Paramount MX User Guide
93 | Page
Ultimately, the tracking of any Paramount MX that has a periodic error of less than 7 arcseconds peak to
peak can be corrected so that the corrected periodic error is below errors introduced by local
atmospheric turbulence or “seeing”. In other words, the periodic error is “in the noise” and not
detectable at the eyepiece or in the measured FWHM of stars on a CCD photo.
Under all but extremely good seeing conditions, measuring periodic error can be difficult, even using an
autoguider because the random errors caused by local seeing conditions are often larger than the actual
periodic error of the worm and gear.
The Compute PEC Curve tab offers an extremely powerful algorithm that can be used to precisely
determine the mount’s periodic error, independent of the errors introduced by local seeing conditions.
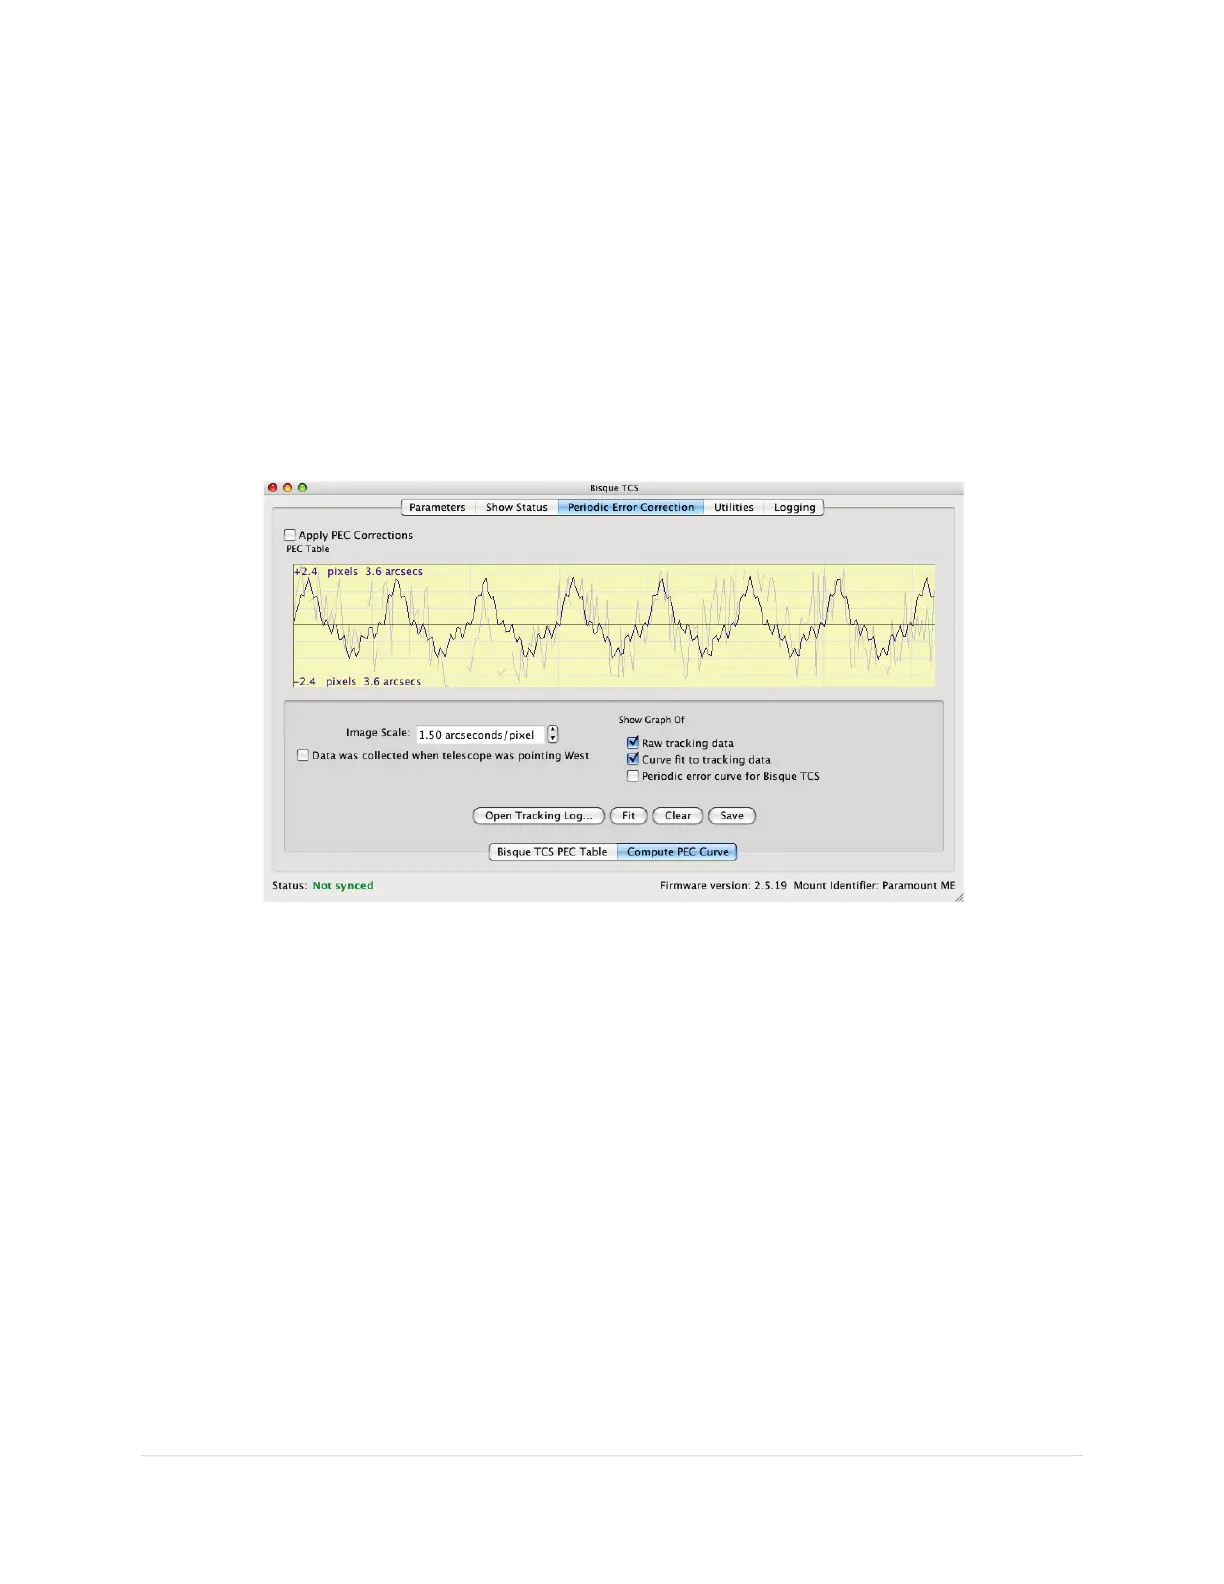
Figure 41: The Compute PEC Curve tab on the Periodic Error Correction tab (Bisque TCS window).
PEC Table Graph
The yellow shaded region can be used to show a graph of the tracking log data, the “best fit” curve to
that data and the actual periodic error curve derived from the best fit curve that is stored to the Bisque
TCS flash memory.
Use the mouse scroll wheel to adjust the relative scale of the graph. Scrolling forward expands the scale
on the graph, scrolling backward magnifies the graph.
Image Scale
Enter the image scale of the optical system, in arcseconds per pixel. Image scale is critical for computing
the correct periodic error from the tracking log data. If you are unsure of the photo’s image scale, use
TheSkyX Professional Edition’s Image Link feature to compute it for you.
Data Was Collected When Telescope Was Pointing West
Turn this checkbox on if the tracking log data was collected when the telescope was pointing to the
West side of the meridian.