31
E-DOC-CTC-20050705-0001 v1.0
Chapter 5
SpeedTouch™ Diagnostics
5.2.2 Using SpeedTouch™ Diagnostics in Mac OS X
Opening the
Diagnostics window
Do one of the following:
Click the SpeedTouch™ Diagnostics icon in the Dock.
In the Finder, choose Go > Applications > SpeedTouch > USB and double-
click Diagnostics.
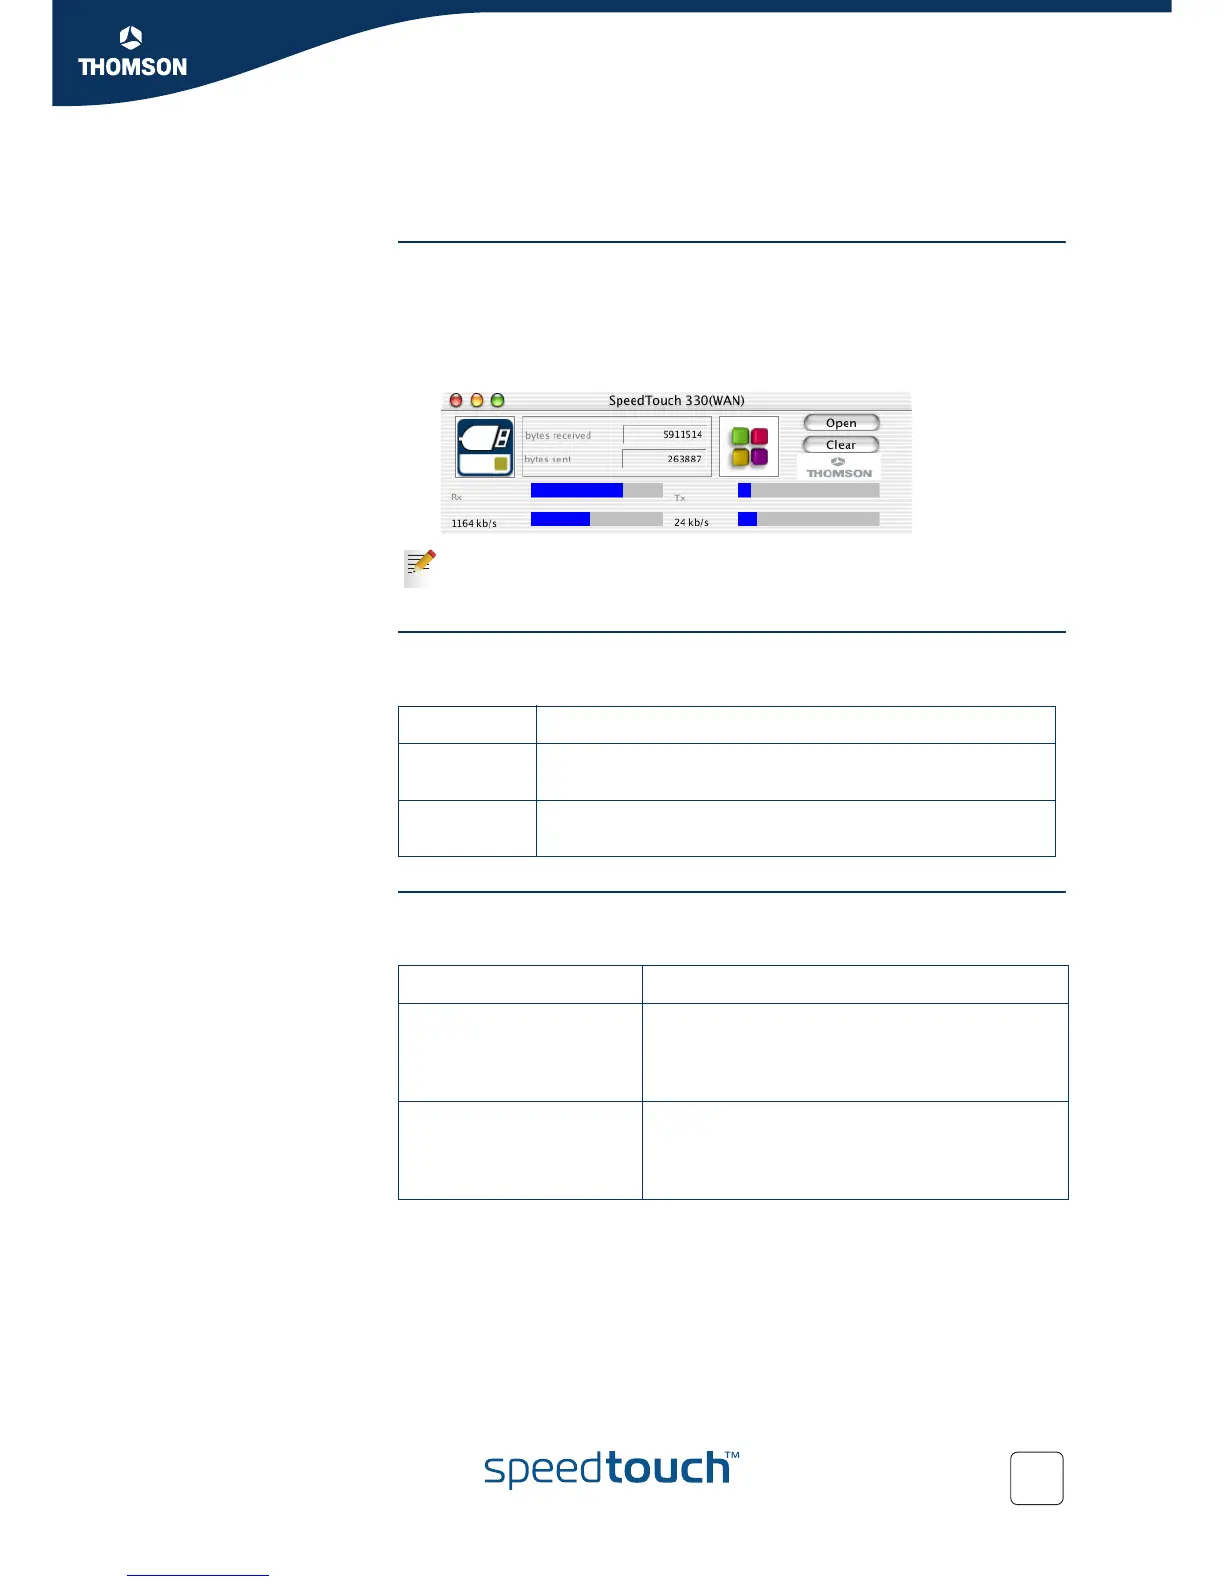
The SpeedTouch™ Diagnostics window appears, as shown in the example below.
Information in the
Diagnostics window
If the SpeedTouch™ has established ADSL line synchronization, the following data
are displayed:
Throughput The throughput bars allow an instant overview of the current and average
performance of the connection.
All throughput indicators are measured relatively to the actual available bandwidth.
In the example above, the Diagnostics window applies to a PPP (PPPoA or
PPPoE) installation. For an RFC1483 installation, the title bar will mention
LAN.
Data Description
Bytes
received
Shows the total number of received bytes since ADSL link
synchronization.
Bytes sent Shows the total number of sent bytes since ADSL link
synchronization.
Throughput Description
Downstream (Rx) Actual Receive rate: Visualizes the current rate of
received Kbps.
Average Receive rate: Visualizes and indicates the
average rate of received Kbps.
Upstream (Tx) Actual Transmit rate: Visualizes the current rate of
transmitted Kbps.
Average Receive rate: Visualizes and indicates the
average rate of transmitted Kbps.