Executing and debugging firmware using a software toolchain UM1671
10/19 DocID025194 Rev 1
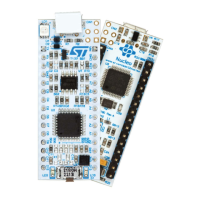
Figure 4. EWARM project successfully compiled
If you need to change your project settings (Include and preprocessor defines), simply go
through the project options:
For Include directories
Project>Options…>C/C++ compiler>
For pre-processor defines
Project>Options…C/C++ compiler>pre-processor>
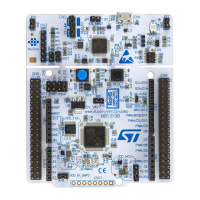
5. In the IAR Embedded Workbench IDE, from the Project menu, select Download and
Debug or, alternatively, click the Download and Debug button in the toolbar, to program
the Flash memory and begin debugging.
Figure 5. IAR Download and Debug button
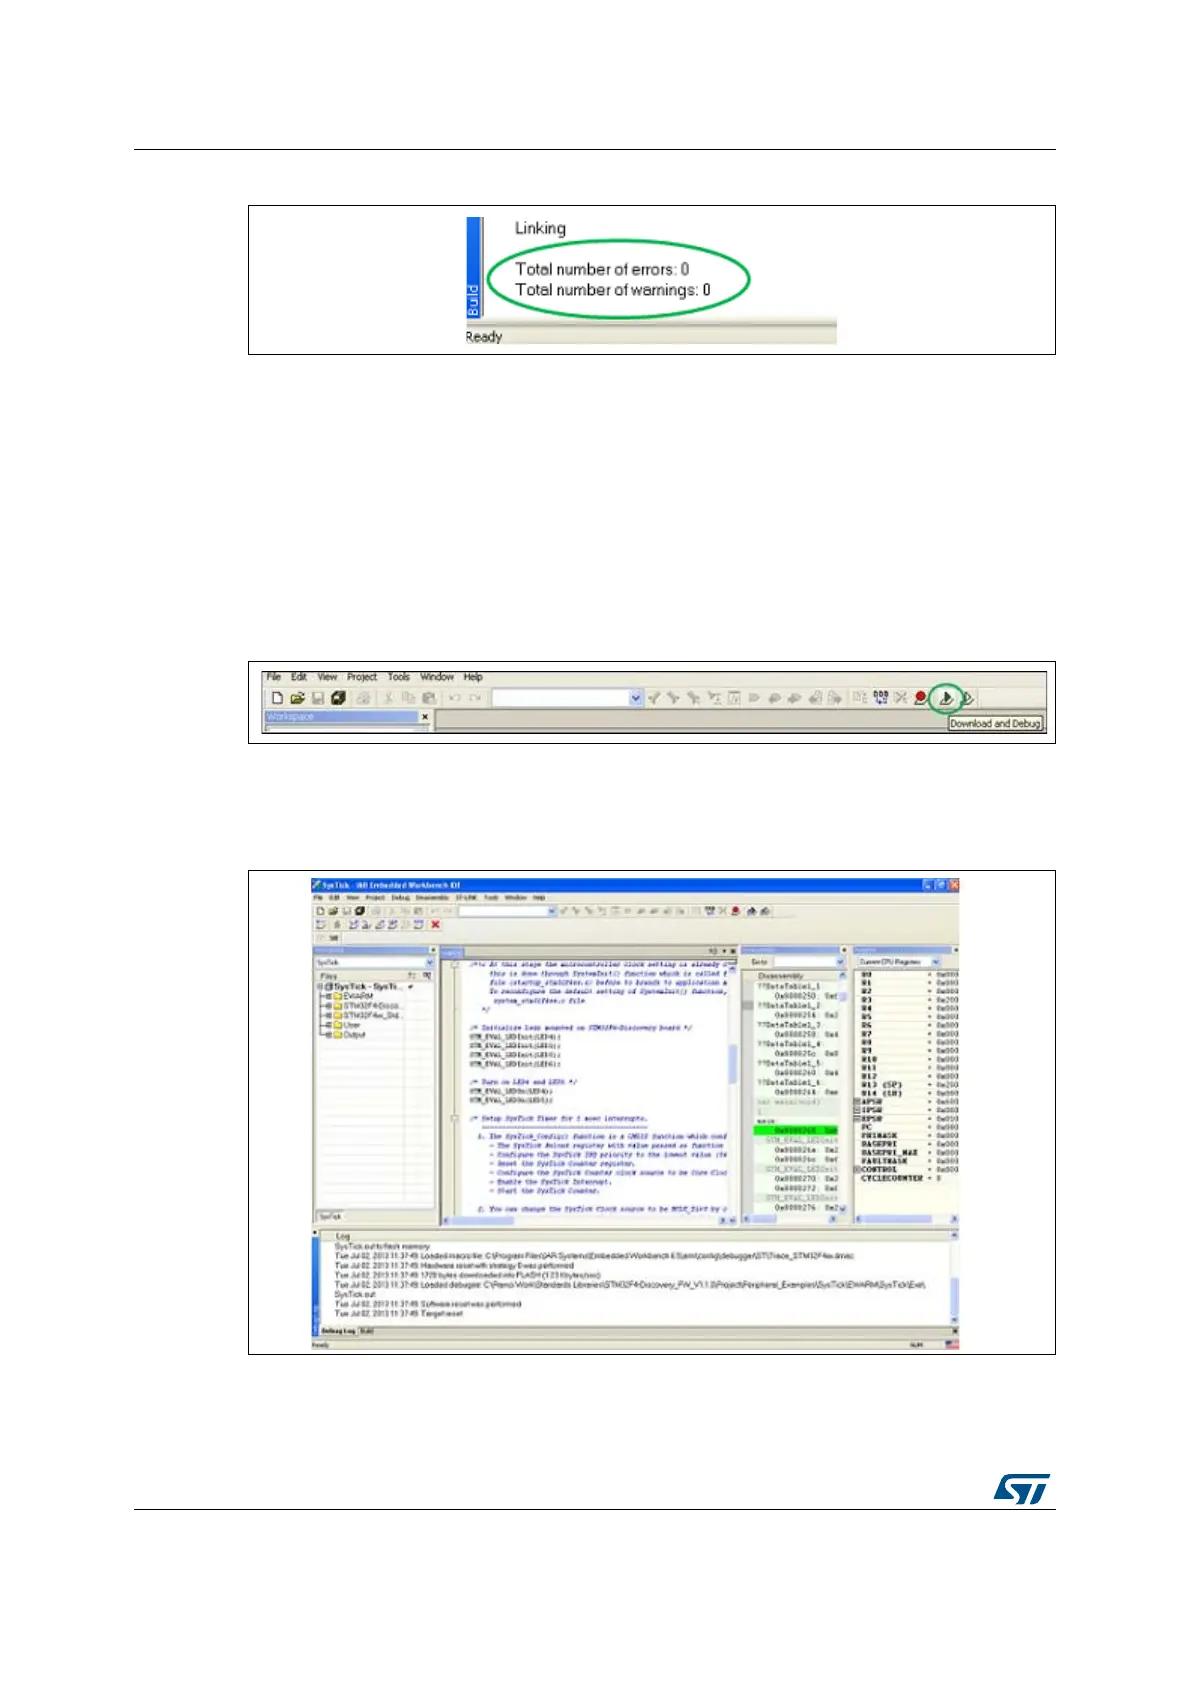
6. The debugger in the IAR Embedded Workbench can be used to debug source code at
the C and assembly levels, to set breakpoints, to monitor individual variables and to
watch events during the code execution.
Figure 6. IAR Embedded Workbench debugger screen
To run your application, from the Debug menu, select Go. Alternatively, click the Go button
in the toolbar to run your application.
 Loading...