Executing and debugging firmware using a software toolchain UM1671
12/19 DocID025194 Rev 1
If you need to change your project settings (Include and preprocessor defines), simply go
through the project options:
For Include directories
Project>Options for Target > C/C++ > Include Paths
For pre-processor defines
Project>Options for Target > C/C++ > Preprocessor symbols > Define
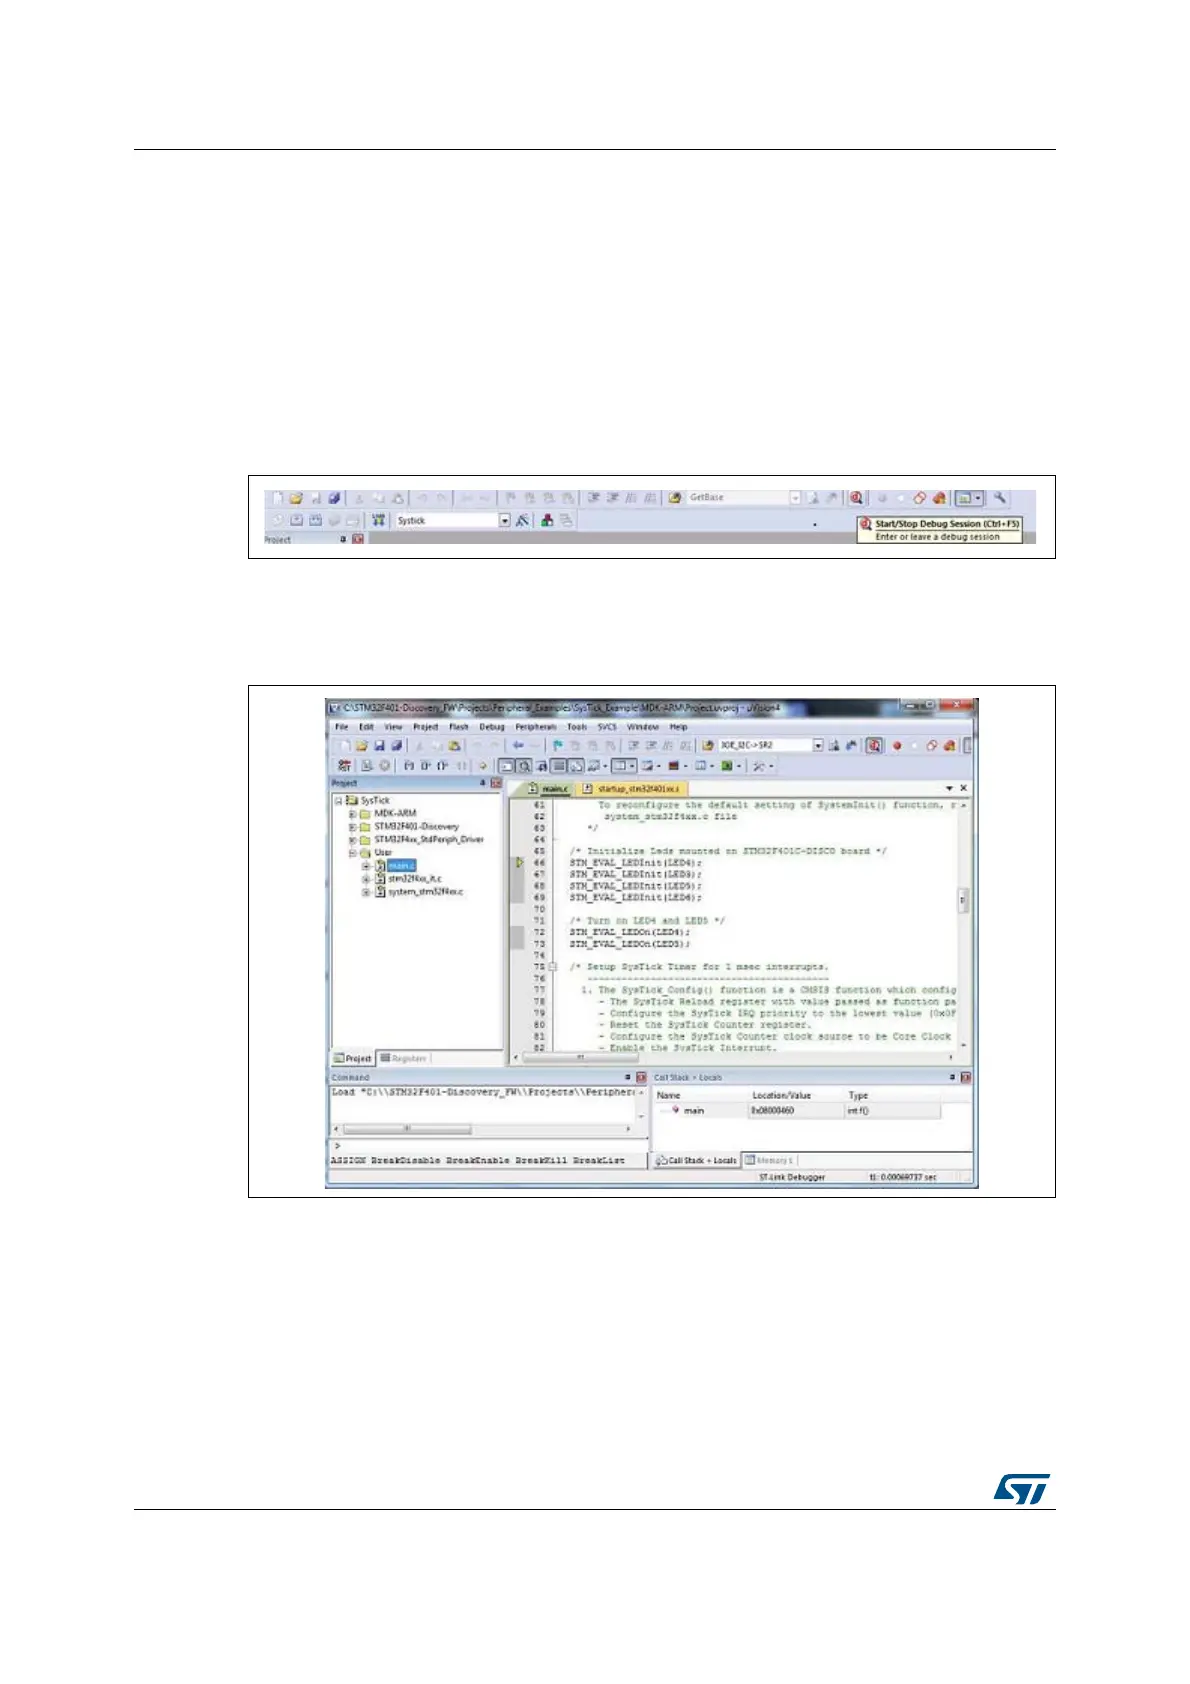
5. In the MDK-ARM IDE, from the Debug menu, select Start/Stop Debug Session or,
alternatively, click the Start/Stop Debug Session button the in toolbar, to program the
Flash memory and begin debugging.
Figure 10. MDK-ARM Start/Stop Debug Session button
6. The MDK-ARM debugger can be used to debug source code at the C and assembly
levels, to set breakpoints, to monitor individual variables and to watch events during the
code execution.
Figure 11. MDK-ARM debugger screen
To run your application, from the Debug menu, select Run. Alternatively, click the Run
button in the toolbar to run your application.
 Loading...