43
Appendix D
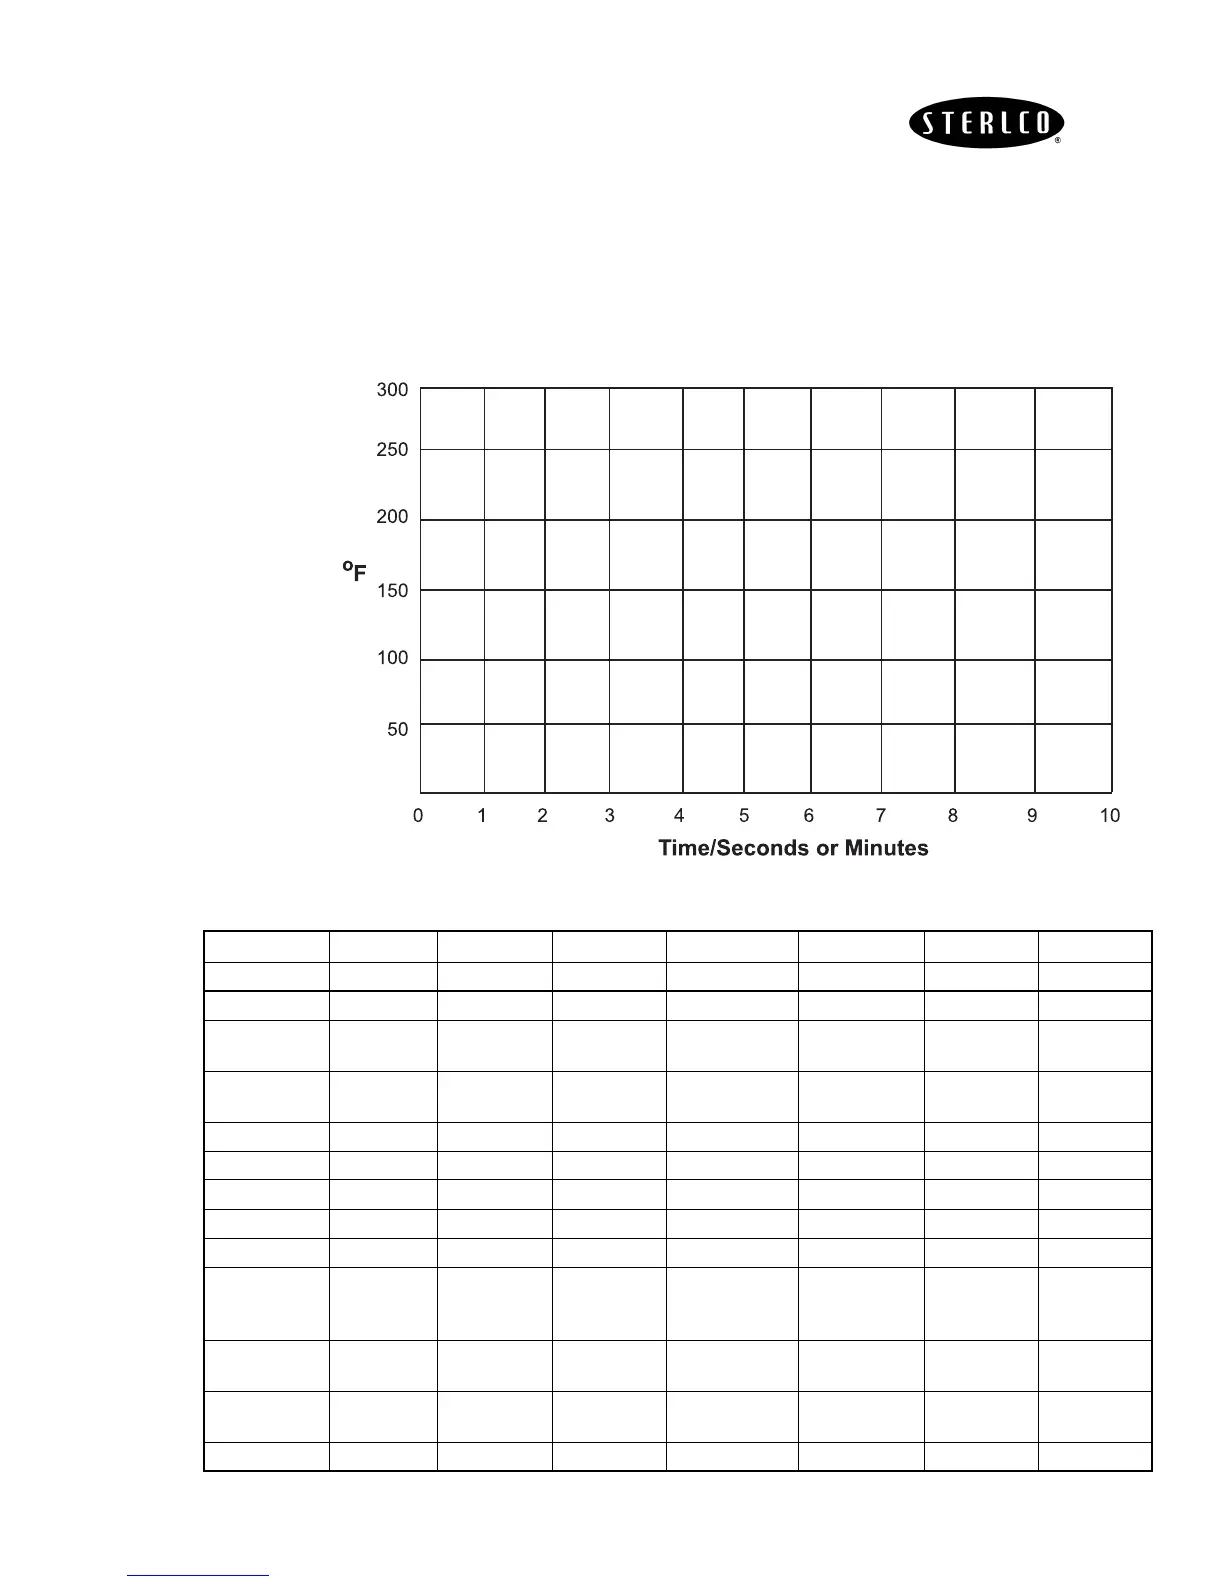
Drawing a Ramp/Soak
Profile
Draw your ramp/soak profile on the record sheet below and fill in the
associated information in the table below. This will give you a permanent
record of your program and will assist you when entering the set point data.
Prompt Function Segment Value
Prompt Function Segment Value
STRT SEG Start Seg. SEG7RAMP Ramp Time 7
END SEG End Seg. SEG8 SP Soak SP 8
RECYCLES
Number of
Recycles
SEG8TIME Soak Time 8
SOAK DEV
Deviation
Value
SEG9RAMP Ramp Time 9
SEG1RAMP Ramp Time 1 SG10 SP Soak SP 10
SEG2 SP Soak SP 2 SG10 TIME Soak Time 10
SEG2TIME Soak Time 2 SG11 RAMP Ramp Time 11
SEG3RAMP Ramp Time 3 SG12 SP Soak SP 12
SEG4 SP Soak SP 4 SG12 TIME Soak Time 12
SEG4TIME Soak Time 4 STATE
Program
Controller
State
SEG5RAMP Ramp Time 5 PROG END
Controller
Status
SEG6 SP Soak SP 6 RAMP UNIT
Engr. Unit for
Ramp
SEG6TIME Soak Time 6