17
4 Reports
Thermal Printer Reports
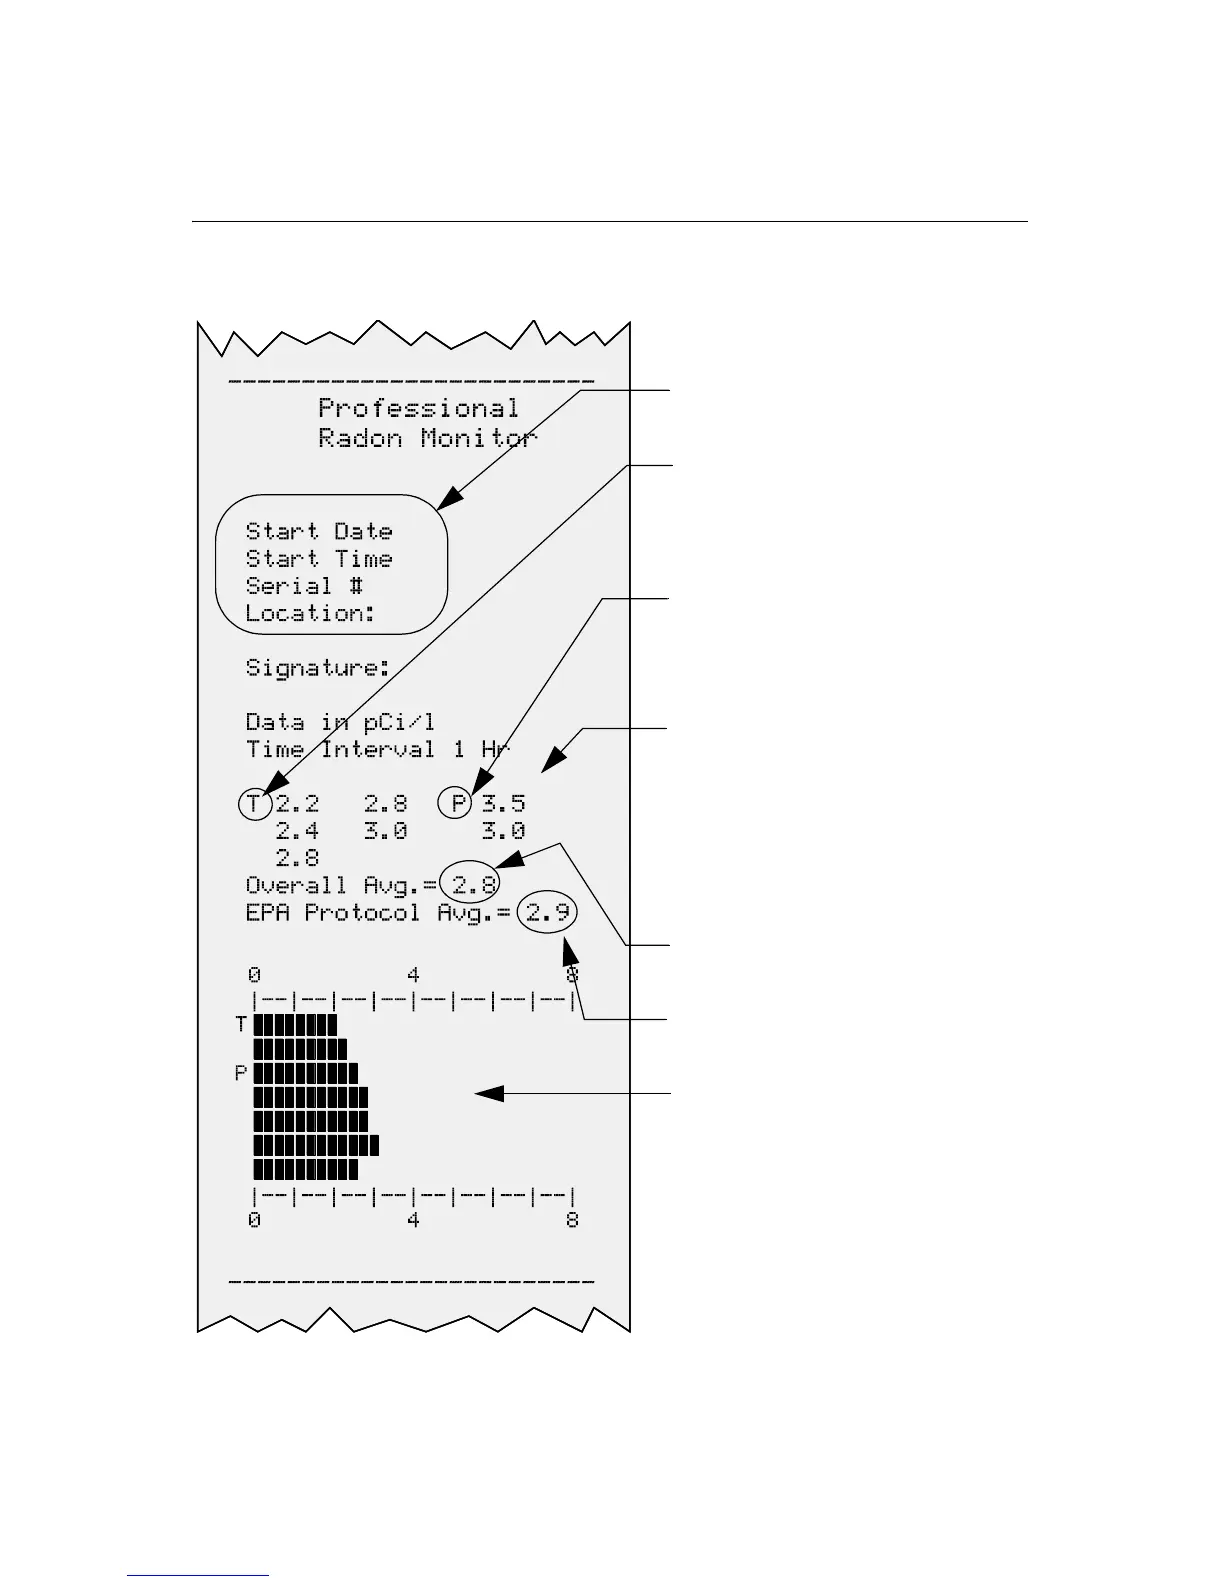
Figure 4-1 shows measurement results displayed in a sample typical thermal
printer report.
Figure 4-1. Example Thermal Printer Report
Information to be filled in by
testing professional.
“T” (tamper) - Indicates
movement occurred during this
interval. The unit may have been
moved during the test.
“P” (power) - Indicates power
interrupt during this interval. The
unit may have been moved during
the test.
TABULAR DATA - Average radon
gas concentration during each
measurement interval is printed
in sequential order; reading in
rows from left to right up to a
maximum of 90, 1-hour
measurement intervals.
Overall Avg. - Long term average
since last memory CLEAR.
EPA Protocol Avg. - Long term
average less the first 4 hours of
data.
Measurement Graph - Each
radon concentration value is
graphically represented in the
same order as the tabular
printout. Scale is automatically
adjusted to show maximum value
in pCi/l.