Display Wavefor
morTraceData
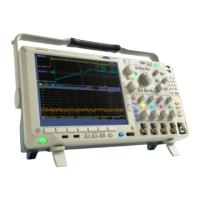
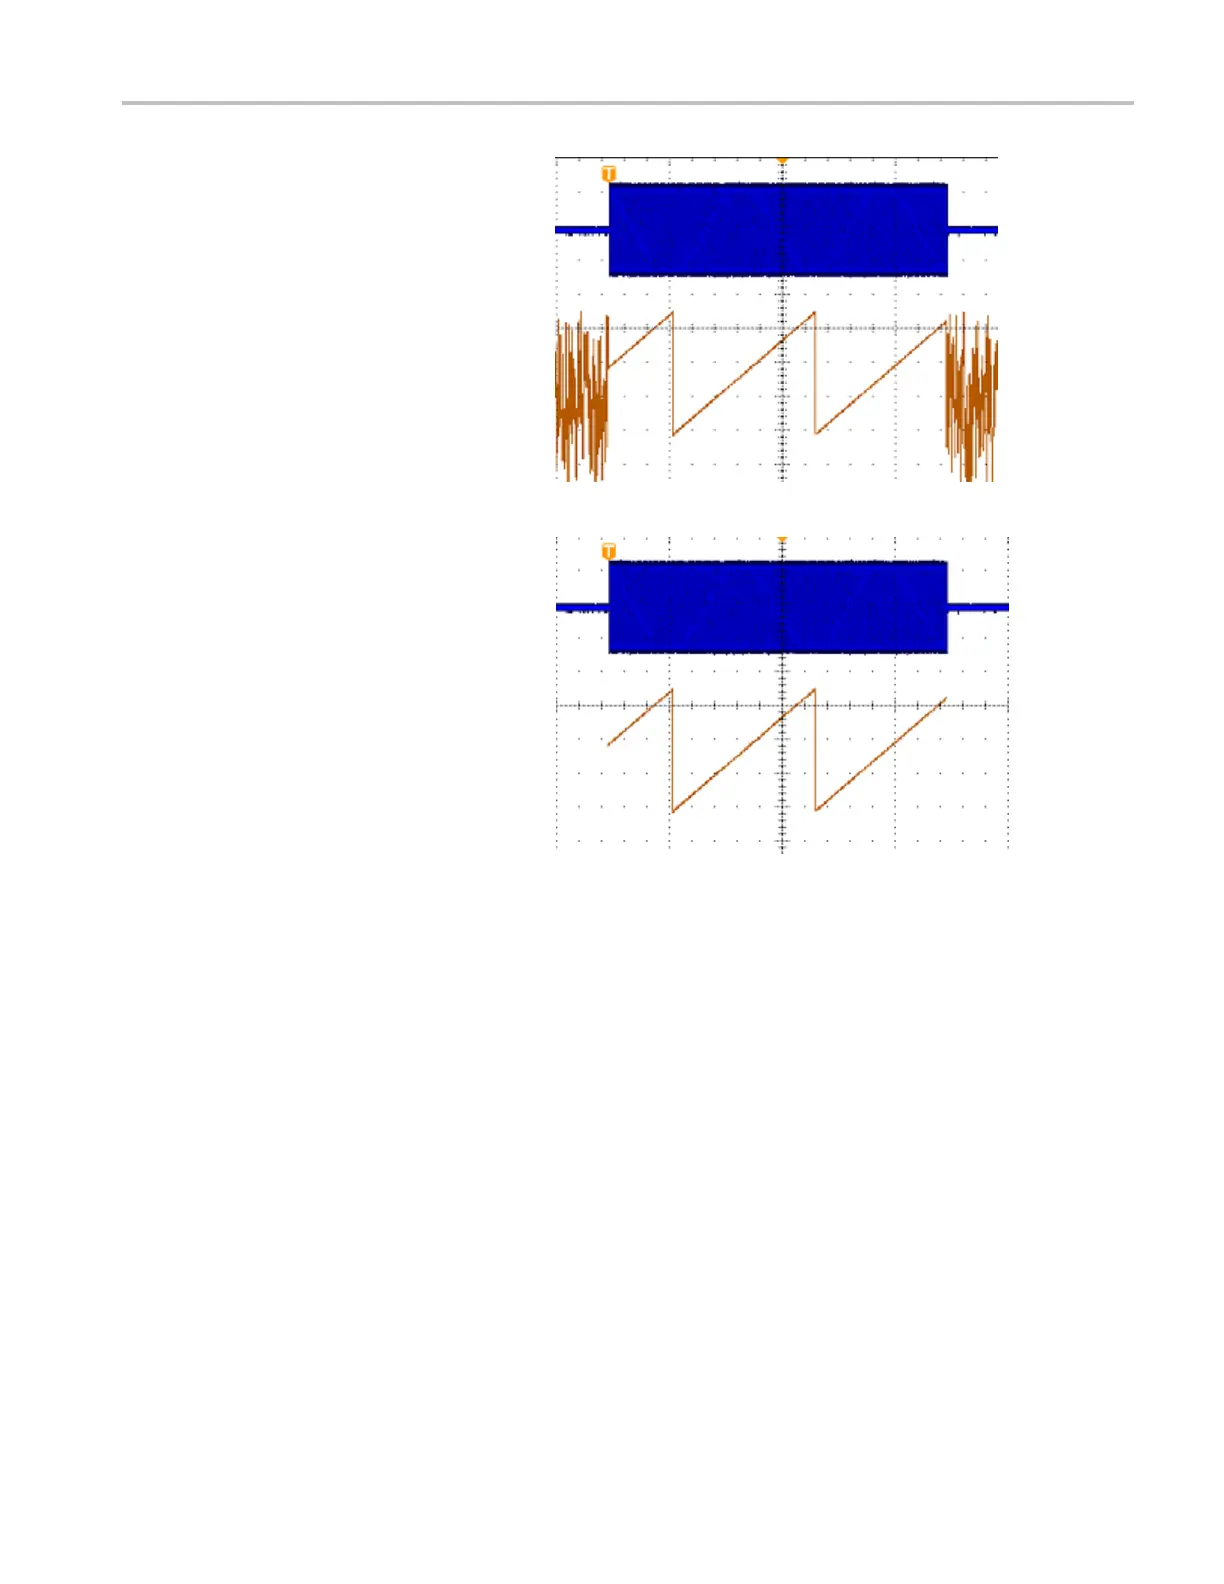
Use squelch to suppress (not display) the
phase and frequency information when
the amplitude
of the RF input is below a
user-specified value. This keeps both the
frequency versus time and the phase versus
time traces f
rom displaying broad bands of
noise when there is no signal present on the
RF input.
Squelch off
Squelch on
Spectrogram Display
The spectrogram display is particularly useful for monitoring slowly-changing RF phenomena. The x-axis represents
frequency, just like the typical spectrum display. The y-axis represents time. Color indicates amplitude.
Spectrogram slices are generated by taking each spectrum and flipping it on its edge so that it is one pixel row tall, and then
assi
gning colors to each pixel based on the amplitude at that frequency with the cold colors of blue and green representing
low amplitude, and the hotter colors of yellow and red indicating higher amplitude. Each new acquisition adds another slice at
the bottom of the spectrogram, and the history moves up one row.
When acquisitions are stopped, you can navigate through the history of the spectrogram by pressing the side-menu slice
cont
rol and turning multipurpose knob a. When acquisitions are stopped and the spectrogram is displayed, the spectrogram
slice trace is displayed as the Normal spectrum trace.
MDO4000 Series Oscilloscopes User Manual 115
 Loading...