Performance Ve rification
Data verificati
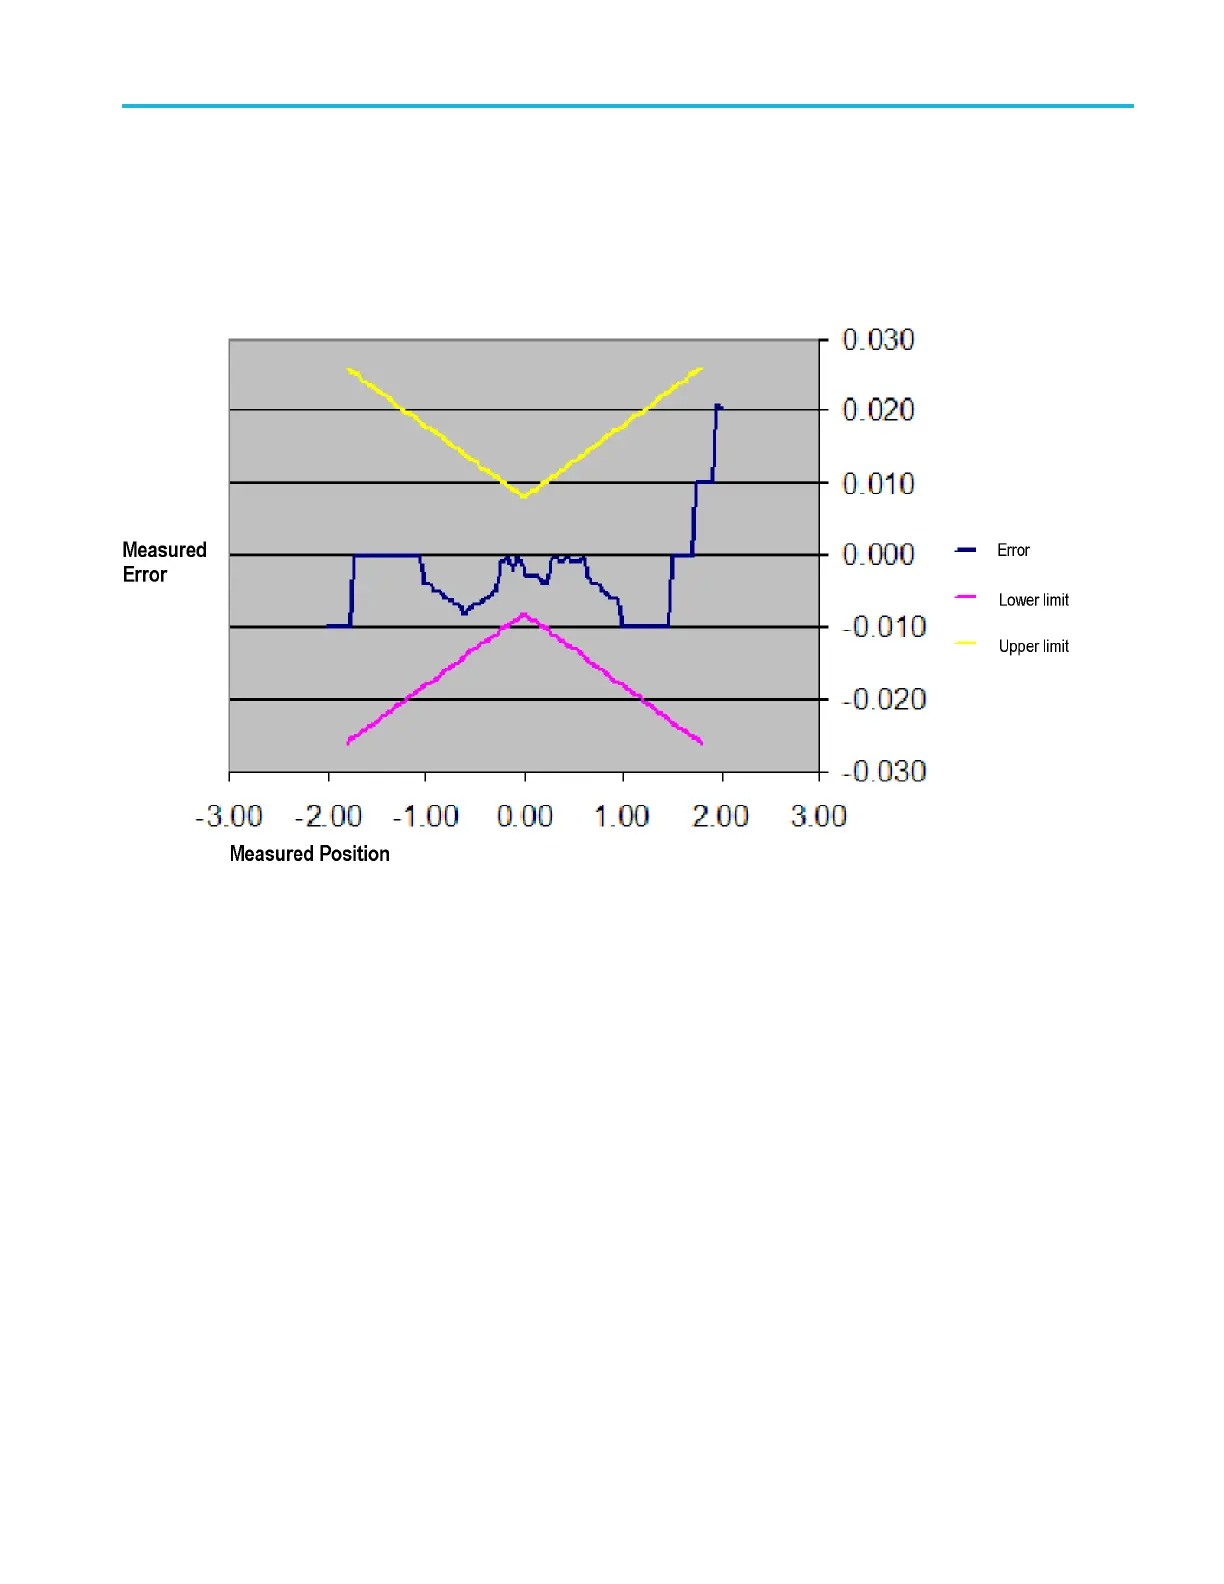
on. To verify data, s et the spreadsheet to present a line graph of
columns D, E, and F. Verify that no error values (the blue line in the center) go
above the yellow line (upper line), or below the purple line (lower line). For
calculations involved in this example, refer to the data in the previous table (see
step 1).
Figure 4-1: Example of a line graph for the Vertical Position Accuracy test
TBS1000 Series Oscilloscope Service Manual 4–13
 Loading...