6 Using the product
38
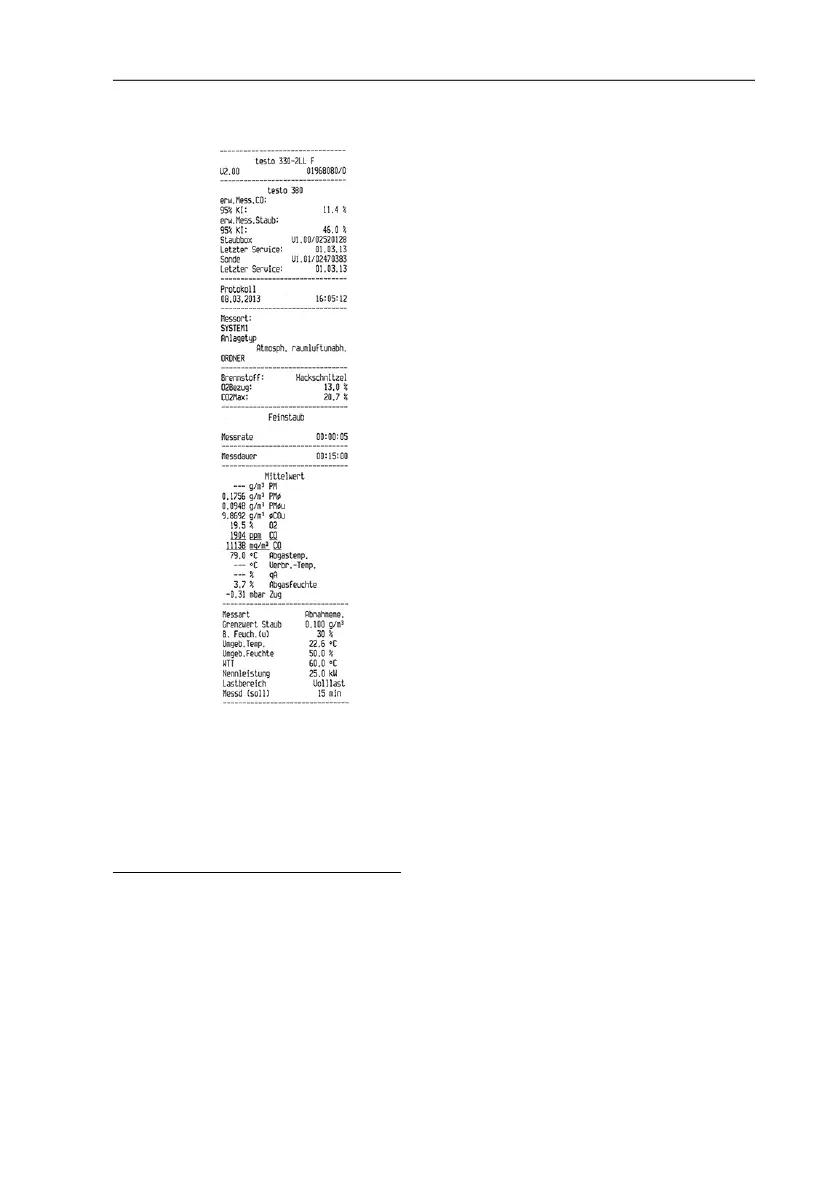
Printout of a test report
2,
3
14. End measurement: [Close].
Options:
> [Options] → Show Graphic: the readings are displayed in the
form of a line graph.
2
KI:= confidence interval
The measurement uncertainty indicates the possible dispersion around the
reading established (as accurately as possible). The associated probability
is characterised by the confidence interval.
The 95% confidence interval specifies the range around the reading within
which the "true value" is presumed to be with 95% probability.
3
The system type can be changed via Address/Location (Air Heater /
Combination Boiler).