8 Dashboard
The dashboard is the home page. It provides an overview of the key system
data: Measuring points and Active alarms.
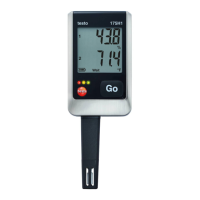
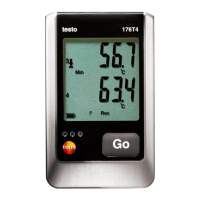
8.1 Measuring points
A summary of all measuring points is displayed.
Click on the icon to display more information.
8.2 Active alarms
A summary of all active alarms and system warnings is displayed. Unread
alarms and system warnings are shown in bold.
Click on the icon to display more information.
On displaying the detailed information, the alarm message/system warning is
marked as "read" and the alarm counter is marked down.
9 Analysis & reports
9.1 Automatic reports
Automatic reports are regularly generated automatically by the system
(Generated reports), according to the settings specified by the user (Report
settings).
Creating an automatic report
1. Click on the Create an automatic report button.
2. Enter the data required for creating the automatic report.
The following settings can be defined and edited:
• Name of the report: designation of the automatic report.
• Measuring points for the report: measuring points that are to be
covered in the report. Click on the checkbox in front of the channel
designation.
• How often is the report to be created?: interval at which the reports
are to be generated. Select a report cycle from the drop-down menu.
• File format: file format in which the reports are to be generated. Select a
file format from the drop-down menu.
• Data views: data views in which the data in the reports is to be
displayed. Click on the checkbox in front of the data view designation.