© 2018 Thorlabs14
TSP01
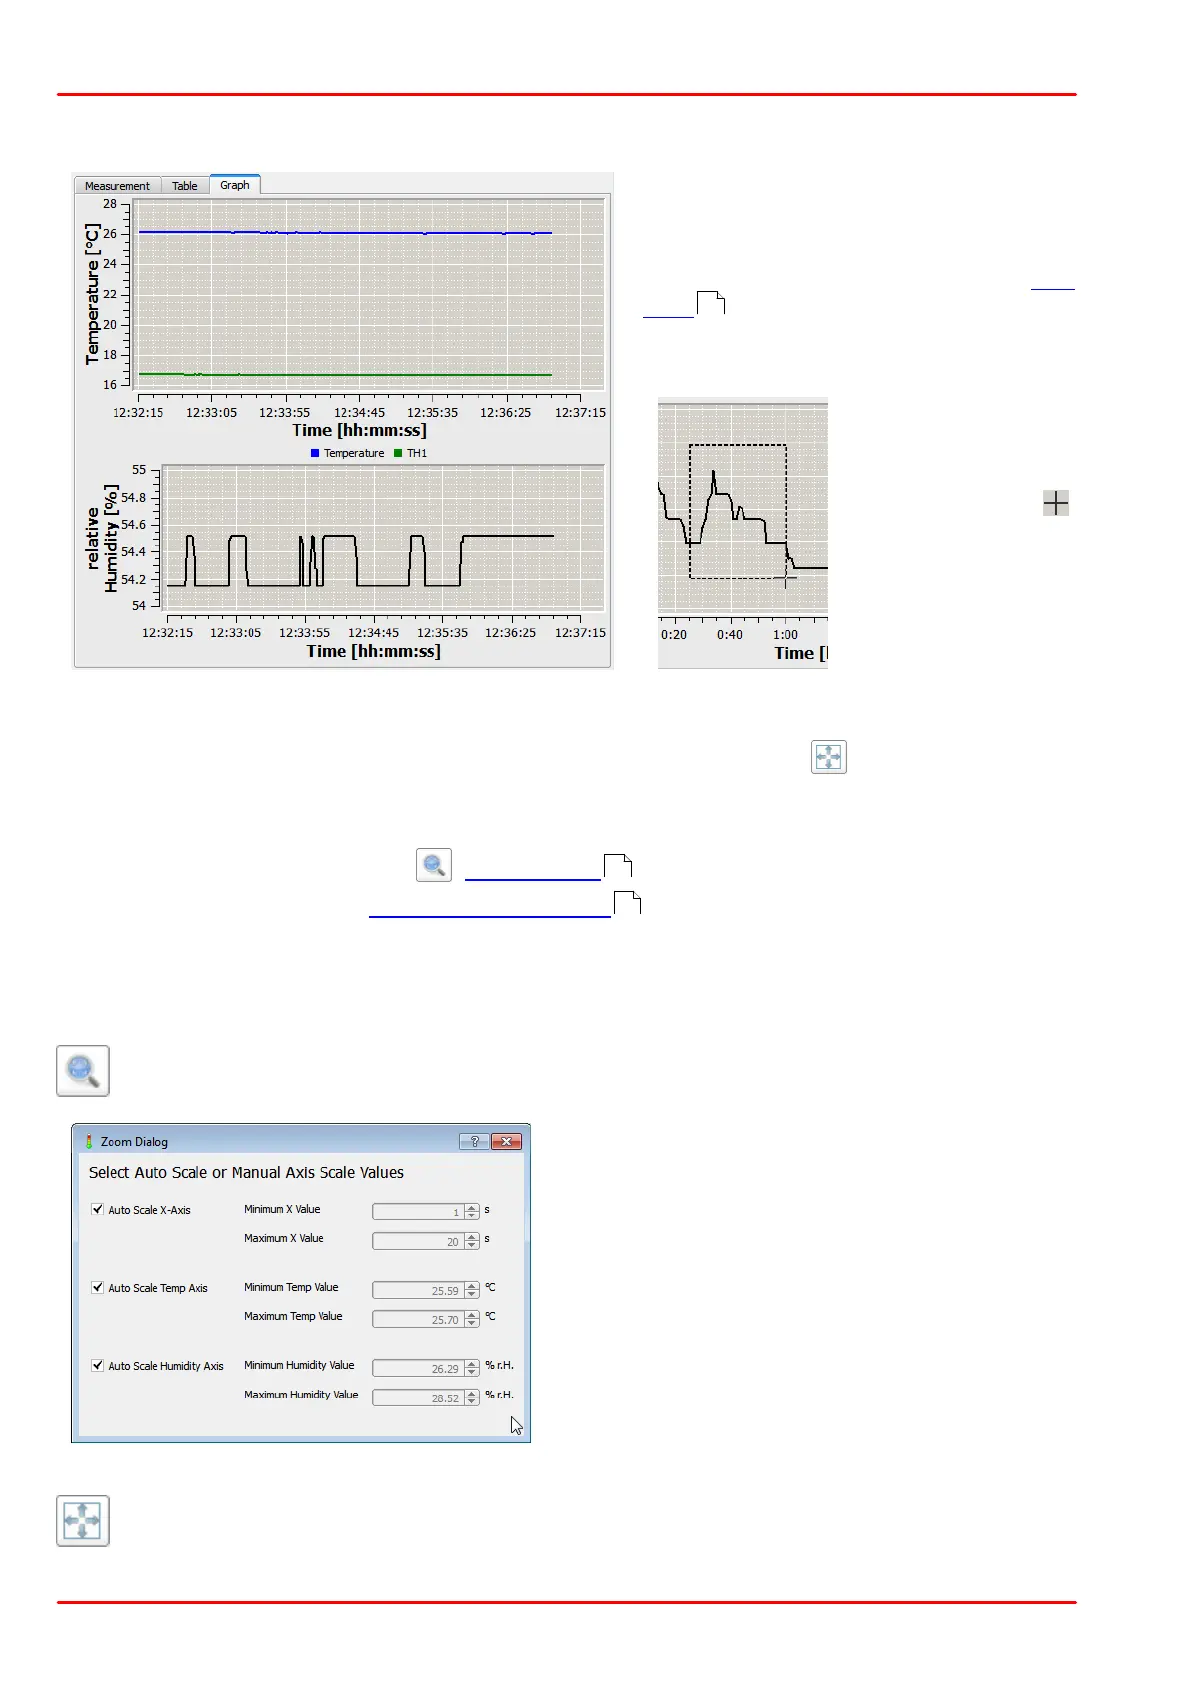
3.2.5 Tab Graph
The graph displayed in this tab shows
the logged measurement values based
on the data in the table of logged val-
ues. It is displayed when with the box
"Show Plot in Graph Tab" in the Set-
tings panel is selected. Thus, logged
data can be shown or hidden in the
graphical display.
The graph display
can be zoomed:
move the mouse
pointer into the graph
- it changes to .
Press and hold the
left mouse button -
the center of the
mouse pointer
changes to white
color. Drag a rect-
angle over the area
to be zoomed and release the mouse button.
In order to return to the full graphical display (auto scaling), click to the
Zoom Home button.
The time axis shows time in [sec] or [hh:min:sec] formats, a complete time stamp cannot be
shown.
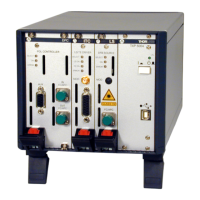
For scaling of the graph, click the Zoom Dialog icon.
The grid can be toggled, see Graph Display Options .
3.2.6 Graph Display Option Menus
The following icons are only visible when the tab Graph is selected.
Zoom Panel
By default, Auto Scaling is enabled. By un-
checking the "Auto Scale..." box, the limits of
the appropriate axis can be changed.
Zoom Home: Click to this icon to display the entire graph (auto scaling).
12
14
15