© 2018 Thorlabs
3 Operating Instructions
15
Show / Hide Grid: This button toggles the grid of the graph display on/off.
Above functions can be reached via the Options drop-down menu as well.
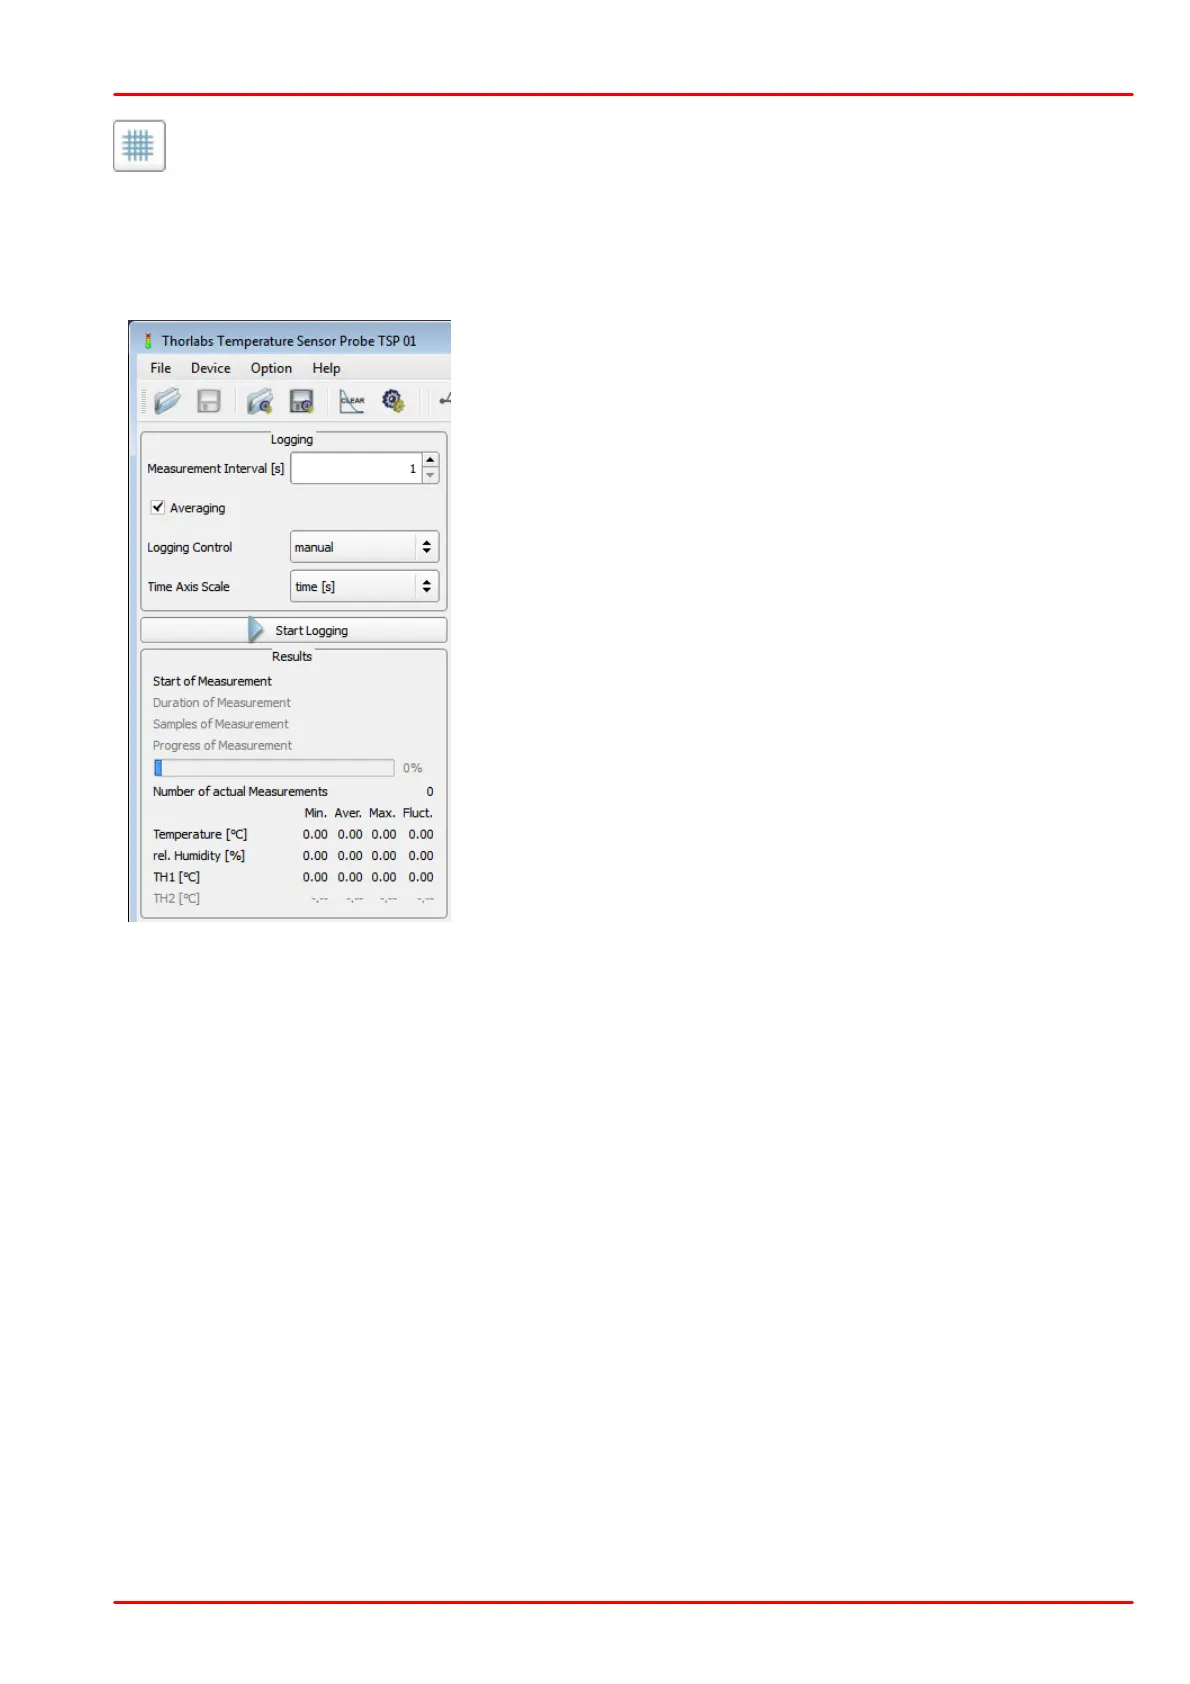
3.2.7 Logging Panel
This is the control panel for recording of temperature(s)
and/or humidity over time.
· Measurement Interval: The logging interval (time
between two measurements) can be set from 1 to 10000
seconds.
· Averaging: When averaging is unchecked, a single meas-
ured value per selected measurement interval will be logged.
By checking this box, all values that are measured each
second will be averaged over the period of the selected mea-
surement interval and only this average value will be logged.
That means per measurement interval for both options one
single value will be logged only.
· Logging Control: Three modes can be set: manual
start/stop, timed logging or logging of a number of samples.
· Time Axis Scale: Three selections are available: time in
seconds, time in hours:minutes:seconds and time stamp
(date an time). The complete time stamp (date and time) will
be displayed only in the Table tab.
· Start / Stop Logging This is a toggle button to start / stop
logging process.
· Results In this pane logging statistics are displayed.
· Start of Measurement: time in [date] hh:min:sec. The date will be displayed only, if the start
date is different from the actual date.
· Duration of measurement: a value will be displayed only in time or samples logging modes
· Samples of measurement: a value will be displayed only in time or samples logging modes
· Below the progress bar, numerical values (minimum, maximum, average and fluctuation). All
values are updated with each new logged value. Fluctuation is the difference between Min
and Max.