19
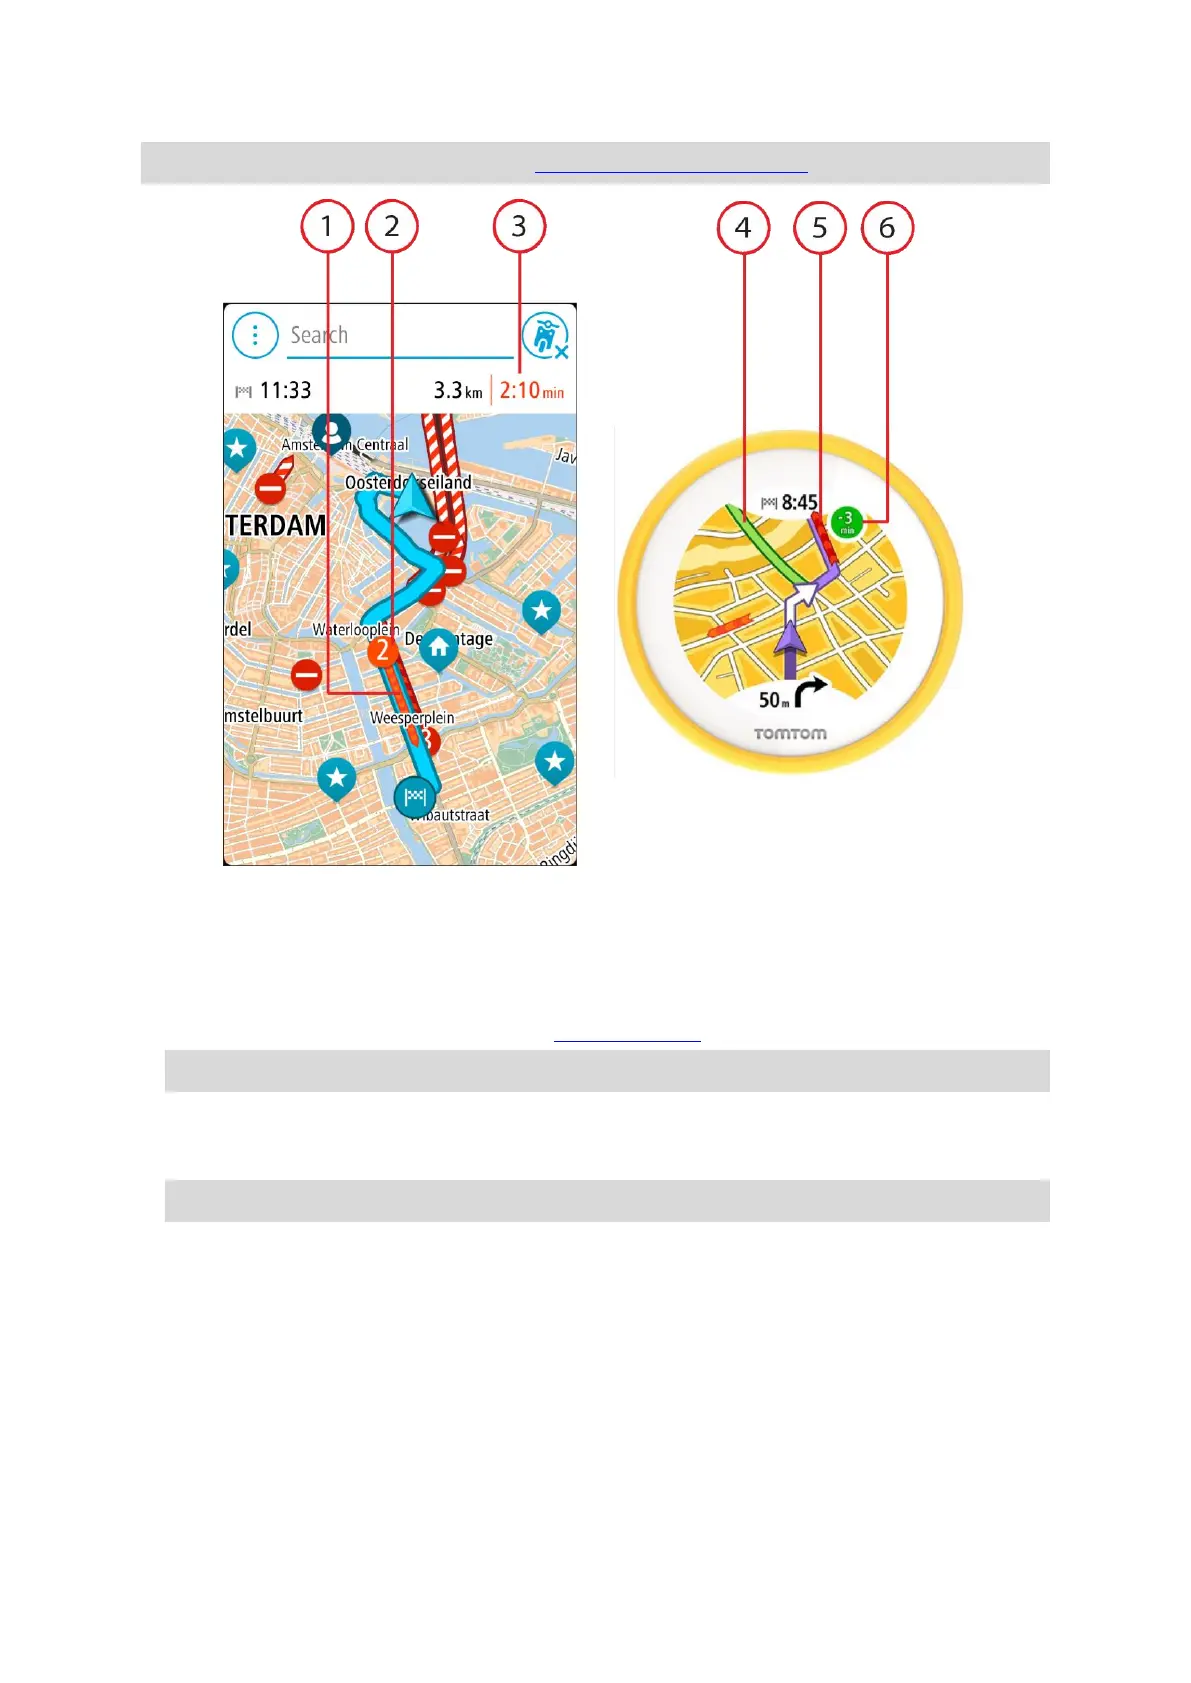
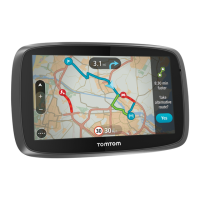
Tip: Select an incident on the app map to see more detailed information.
1. Traffic incident on your route. The length of the coloured tube shows the length of the incident.
2. Traffic incident symbol showing the delay time in minutes.
The colour of the incident indicates the speed of traffic relative to the maximum allowed speed
at that location, with red being the slowest. The stripes on the traffic jam are also animated to
show the speed of the traffic, where appropriate.
For a complete list of incident types, see Traffic incidents.
Tip: You see weather symbols on the map if there is bad weather such as heavy rain or snow.
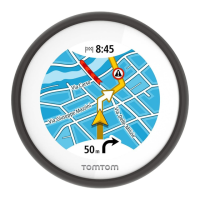
3. The traffic delay in minutes on your planned route.
4. The alternative route to avoid the incident. Ride towards the alternative route to select it. VIO
automatically calculates and shows your new route.
Note: It may not be possible to find an alternative route around the incident if none exists.
5. Traffic incident on your route. The length of the coloured tube shows the length of the incident.
6. When the indicator is red, this is the time delay on your route. When the indicator is green, this
is the time you will save if you take the alternative route.
Looking at traffic on your route
Information about traffic incidents on your route is shown on the VIO app map.
To get more information about an incident, select an incident in the app map. The map opens
zoomed in on the incident and a pop-up opens showing detailed information about the traffic
incident.