3.5. Histogram view
16
3.5. Histogram view
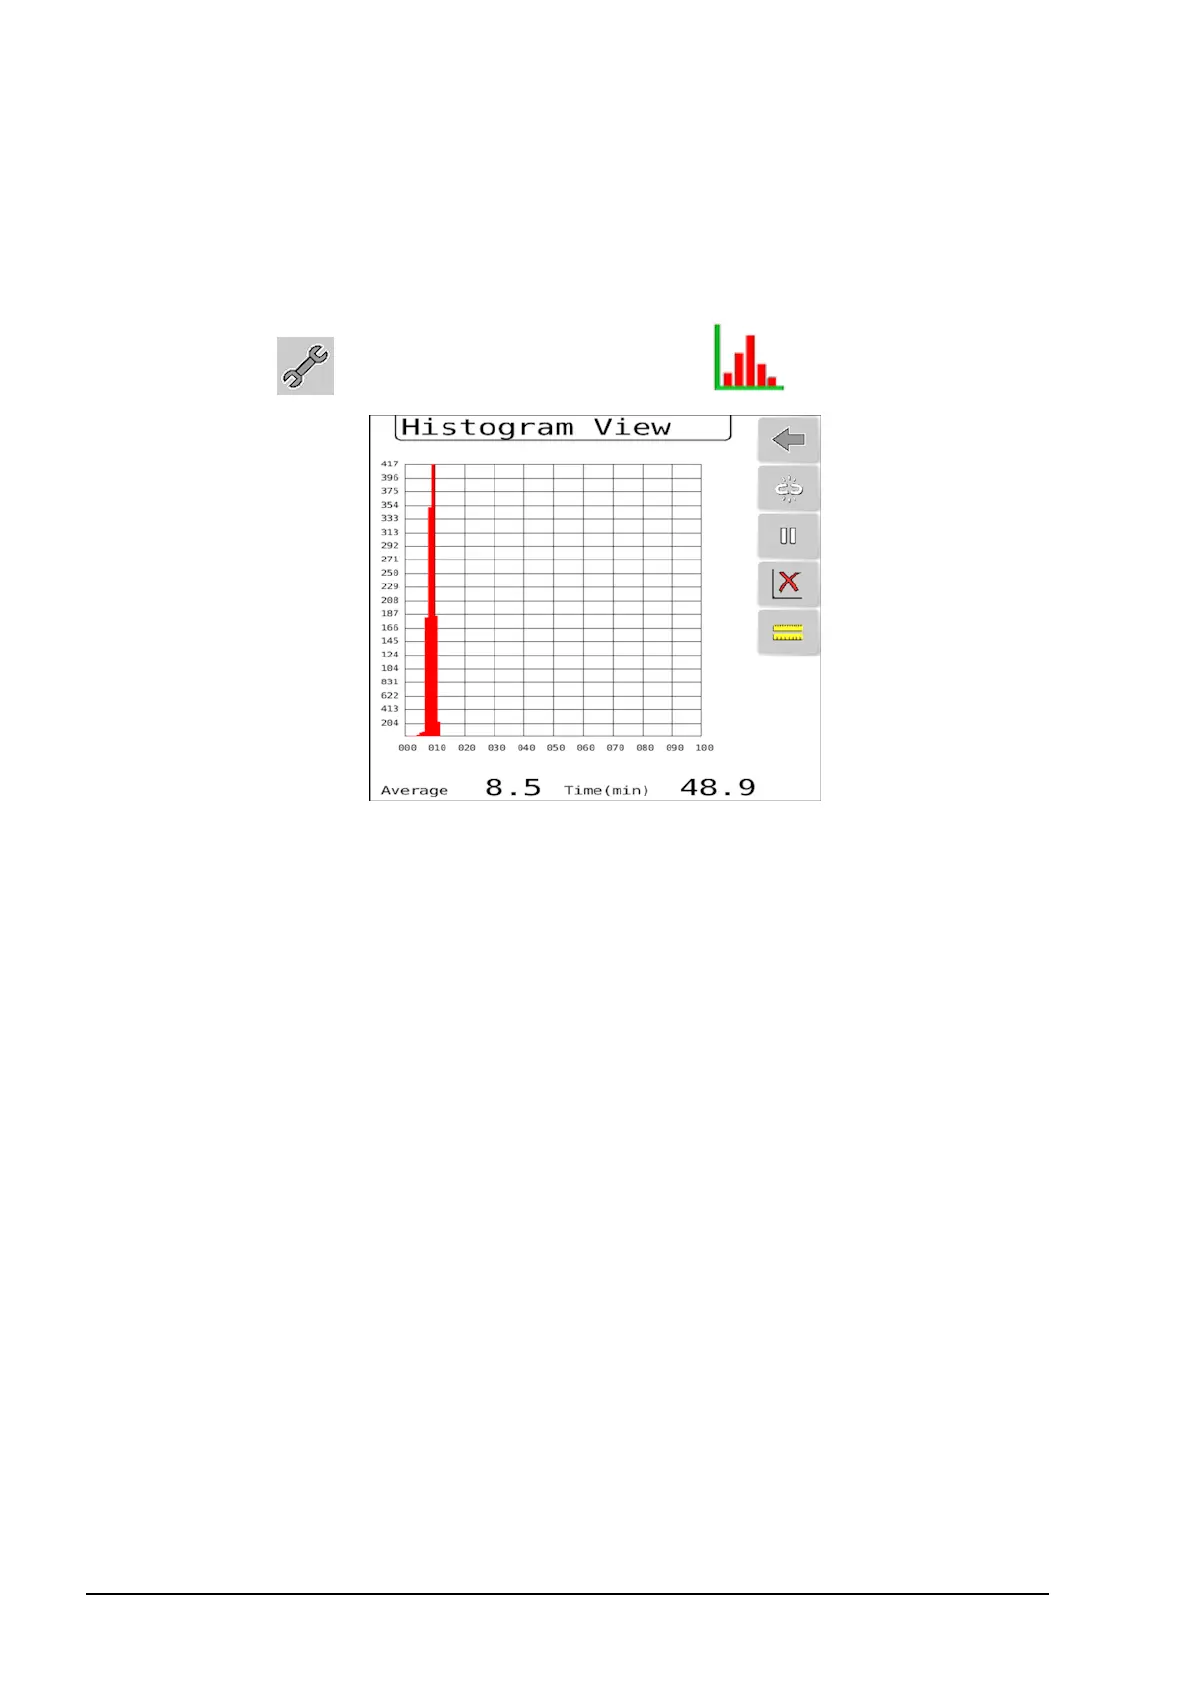
The histogram shows the average and distribution of the CropSpec
sensor data for a given sample area.
1.
Select and select Histogram View .
The X axis is the CropSpec value (biomass %) and the Y axis is the
frequency/number of times each CropSpec value occurs in the
sample.
The histogram functionality can be used to monitor the average
CropSpec value in the field or to assist in setting up an ‘on the go’
treatment plan using a prescription.
For example; when using Two Point prescription mode (see page 25),
the histogram can be used to determine the two calibration
points.The user could sample a good crop area in the field and then
an area with poor crop and use the two CropSpec average values
obtained as the calibration points for the prescription.
When using One Point plus Slope prescription mode (see page 29),
an average of a larger area of the field can be used to determine the
average CropSpec value and a corresponding application rate can be
assigned.