Copyright © 2012 Test Products International, Inc. 9070 Vibration Analysis
PAGE 8
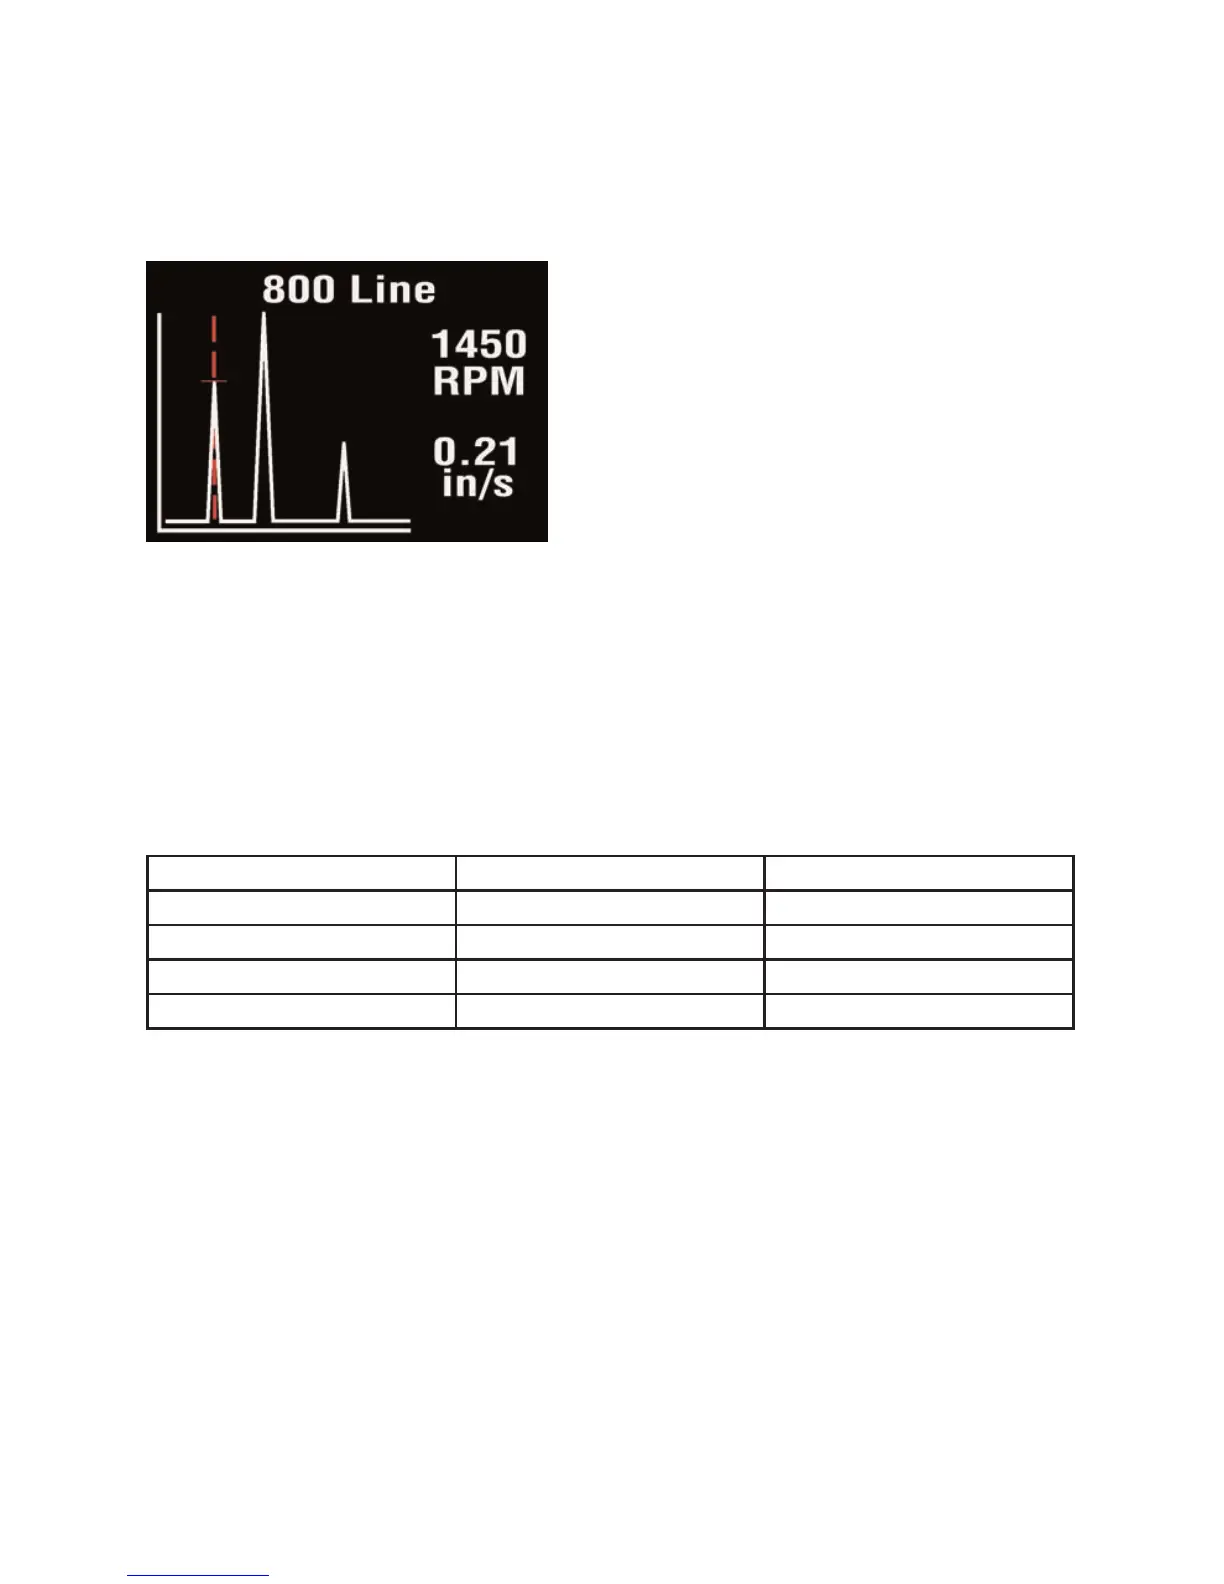
2.2.3 Frequency spectrum
Pressing the square button once more brings up a display similar to
that shown below, where the vibration levels are shown as a frequency
spectrum in the range from 0 to 1kHz.
The heights of the peaks indicate the
RMS vibration level in (mm/s or inch/s)
at each frequency point in the spectrum.
The readings to the right of the screen
show the frequency in (Hz or RPM)
and the RMS vibration level in (mm/s
or inch/s) at the position of the cursor
(red dotted line).
The cursor position can be moved by use of the left (<) and right (>)
arrow buttons.
Continuing to press the square button successively increases the
resolution of the frequency axis from 100 Lines (i.e. 10Hz or 600 RPM
resolution) to 200, 400 and finally 800 Lines (i.e. 1.25Hz or 75 RPM
resolution) as shown in the table below.
Increasing the resolution effectively zooms into the frequency spectrum
display and at the higher resolutions the display must be scrolled by
using the left and right arrow buttons in order to view the full spectrum.
Resolution (lines) Resolution (Hz) Resolution (RPM)
100 10 600
200 5 300
400 2.5 150
800 1.25 75