User's Manual
750 50 0042 03 62
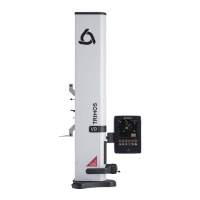
11.2.3 Histogram
Presentation of the results by nominal value in the form of
a histogram.
It is admitted that the values are distributed according to
the normal law. This allows the drawing of the probability
density curve (also called Gauss curve).
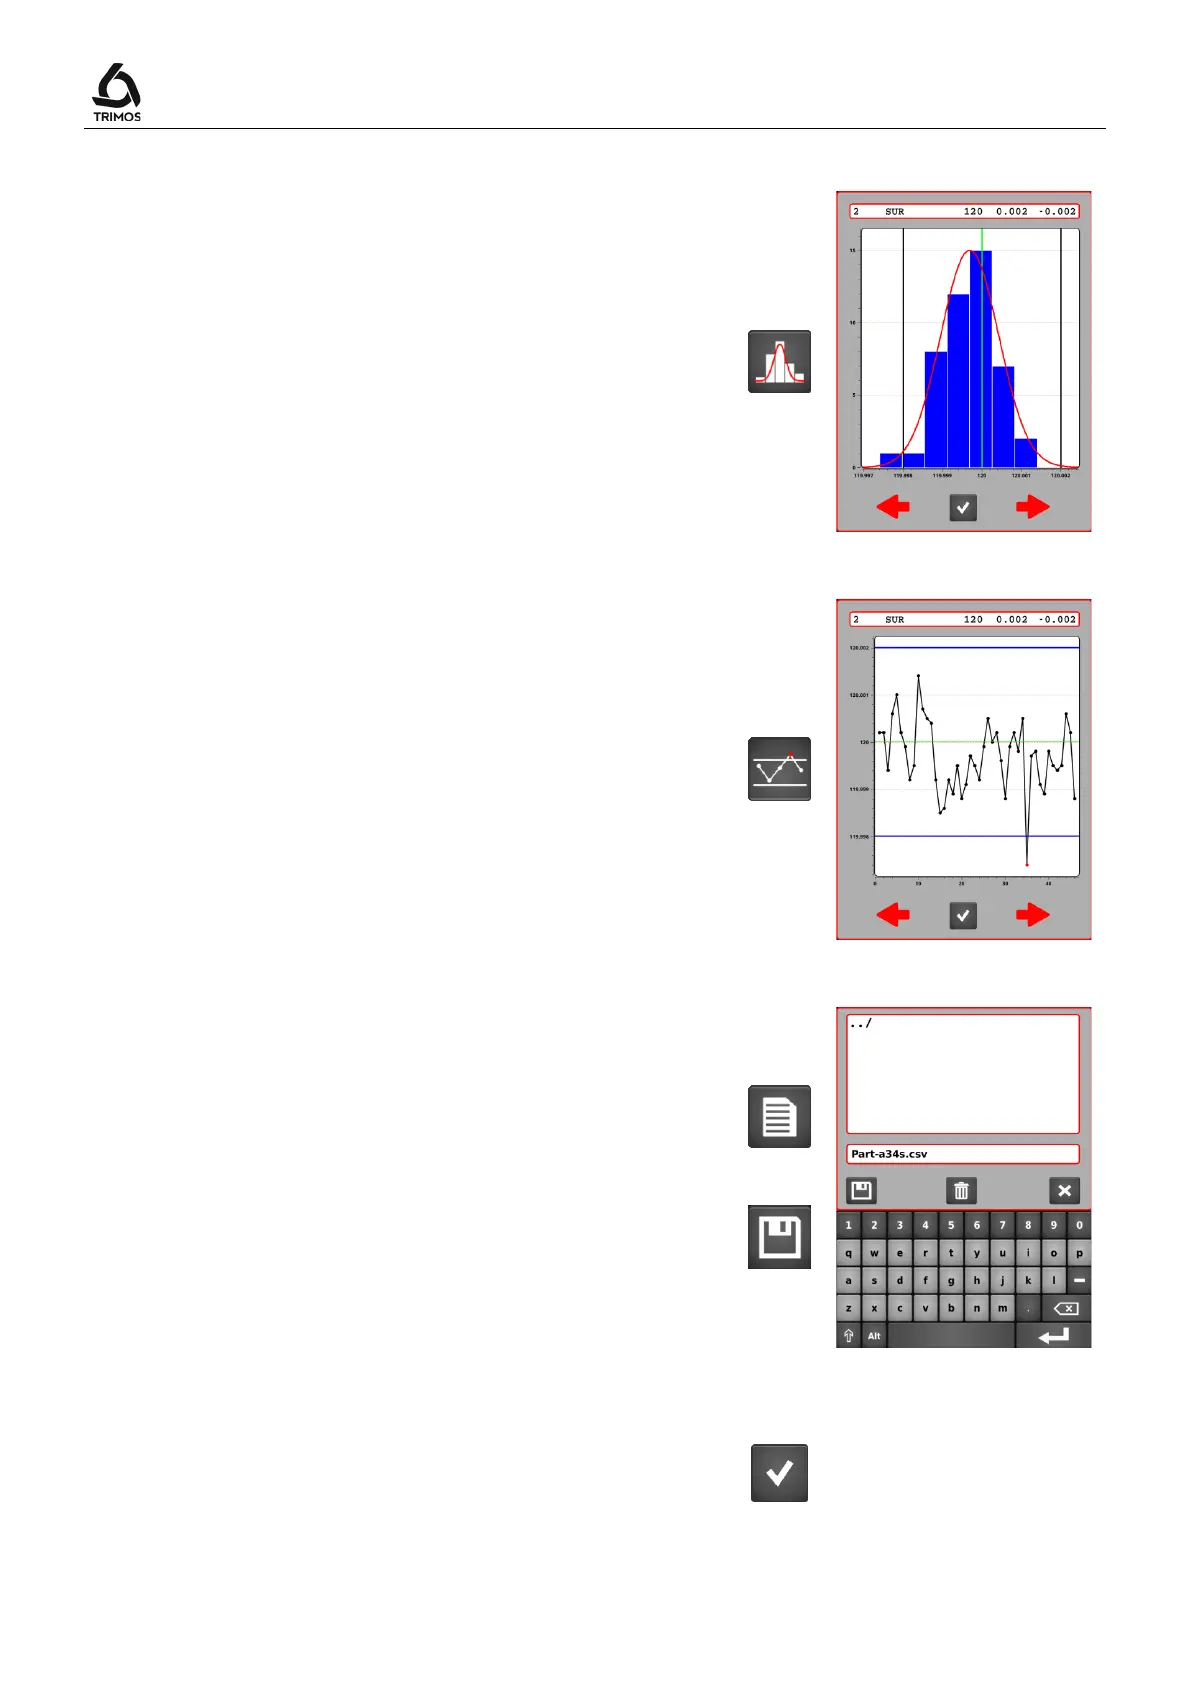
11.2.4 Control Chart
The control chart represents the evolution of the results
according to the nominal value and its tolerances.
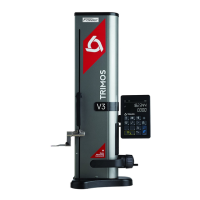
11.2.5 Exporting results in .csv format
It is possible to export a batch in .csv format.
To do this open the following menu, select
enter a file name.
Confirm with the save key.
11.3 Quit the Statistic Analysis Mode
To exit the statistics mode press the following key from
the start menu.