Chapter 3
36
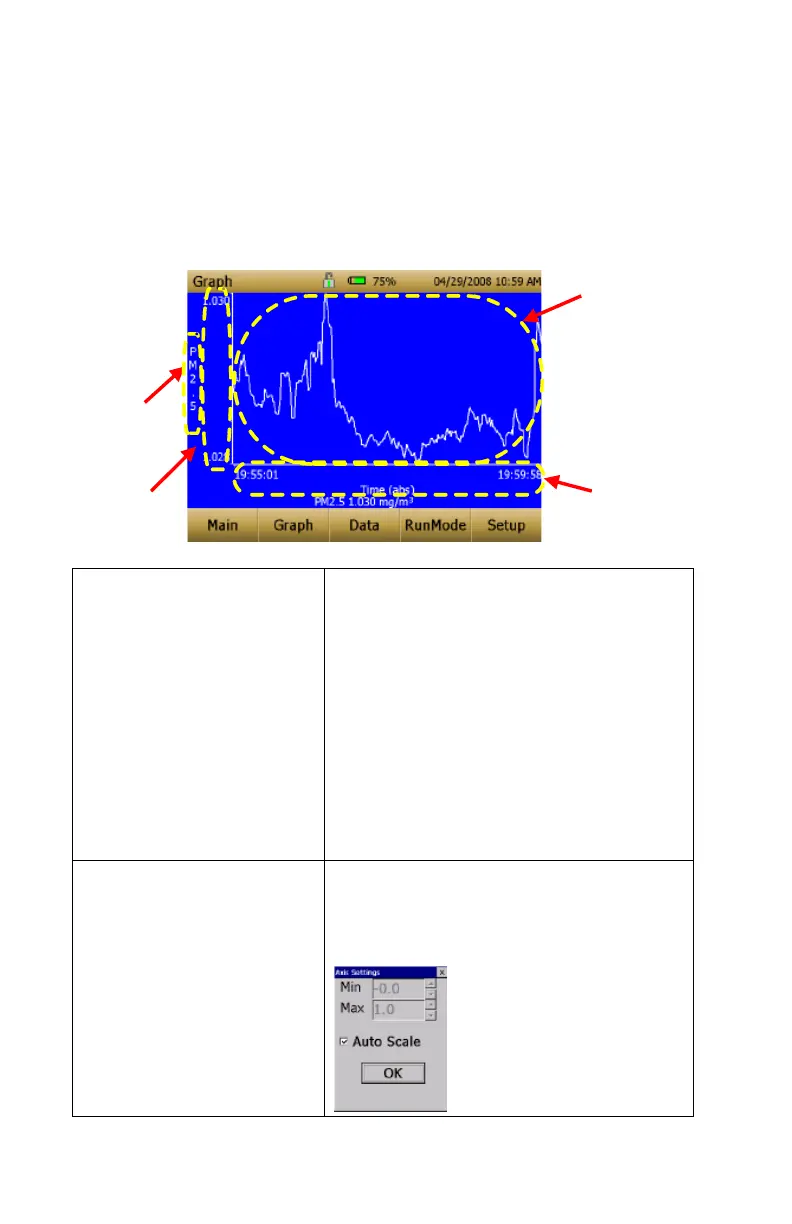
Graphing
During sampling, pressing the Graph button displays current readings in
graphical form.
• During Survey Mode, five (5) minutes of running real-time data is
displayed graphically.
• During Logging Mode, the entire log test time is displayed on the graph.
Time Display
Pressing the Time x-axis label on the
graph screen switches between Time (s),
Time (abs), and Time (rel).
Time (s): Elapsed time from first logged
point (log interval) to the last logged point
(test length).
Time (rel): Relative time from zero to last
logged point (test length – log interval).
Time (abs): Absolute time from first
logged point (test start + log interval) to
last logged point (test stop).
Scale Display
Pressing in the Scale Display area will
bring up a dialog that will allow changing
between auto scaling and user scaling of
the Y-axis.
(live area)
Scale Display
(live key)
Data Region
(live area)
 Loading...