5
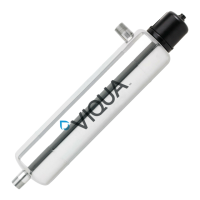
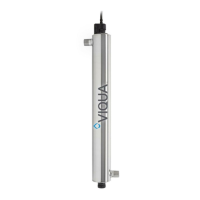
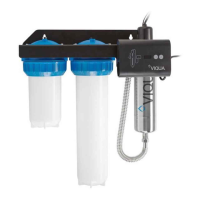
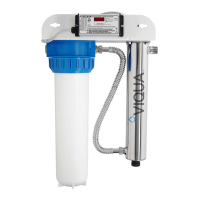
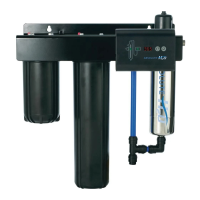
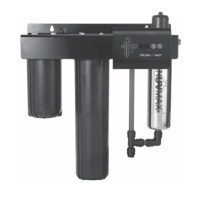
3.0 SYSTEM OVERVIEW
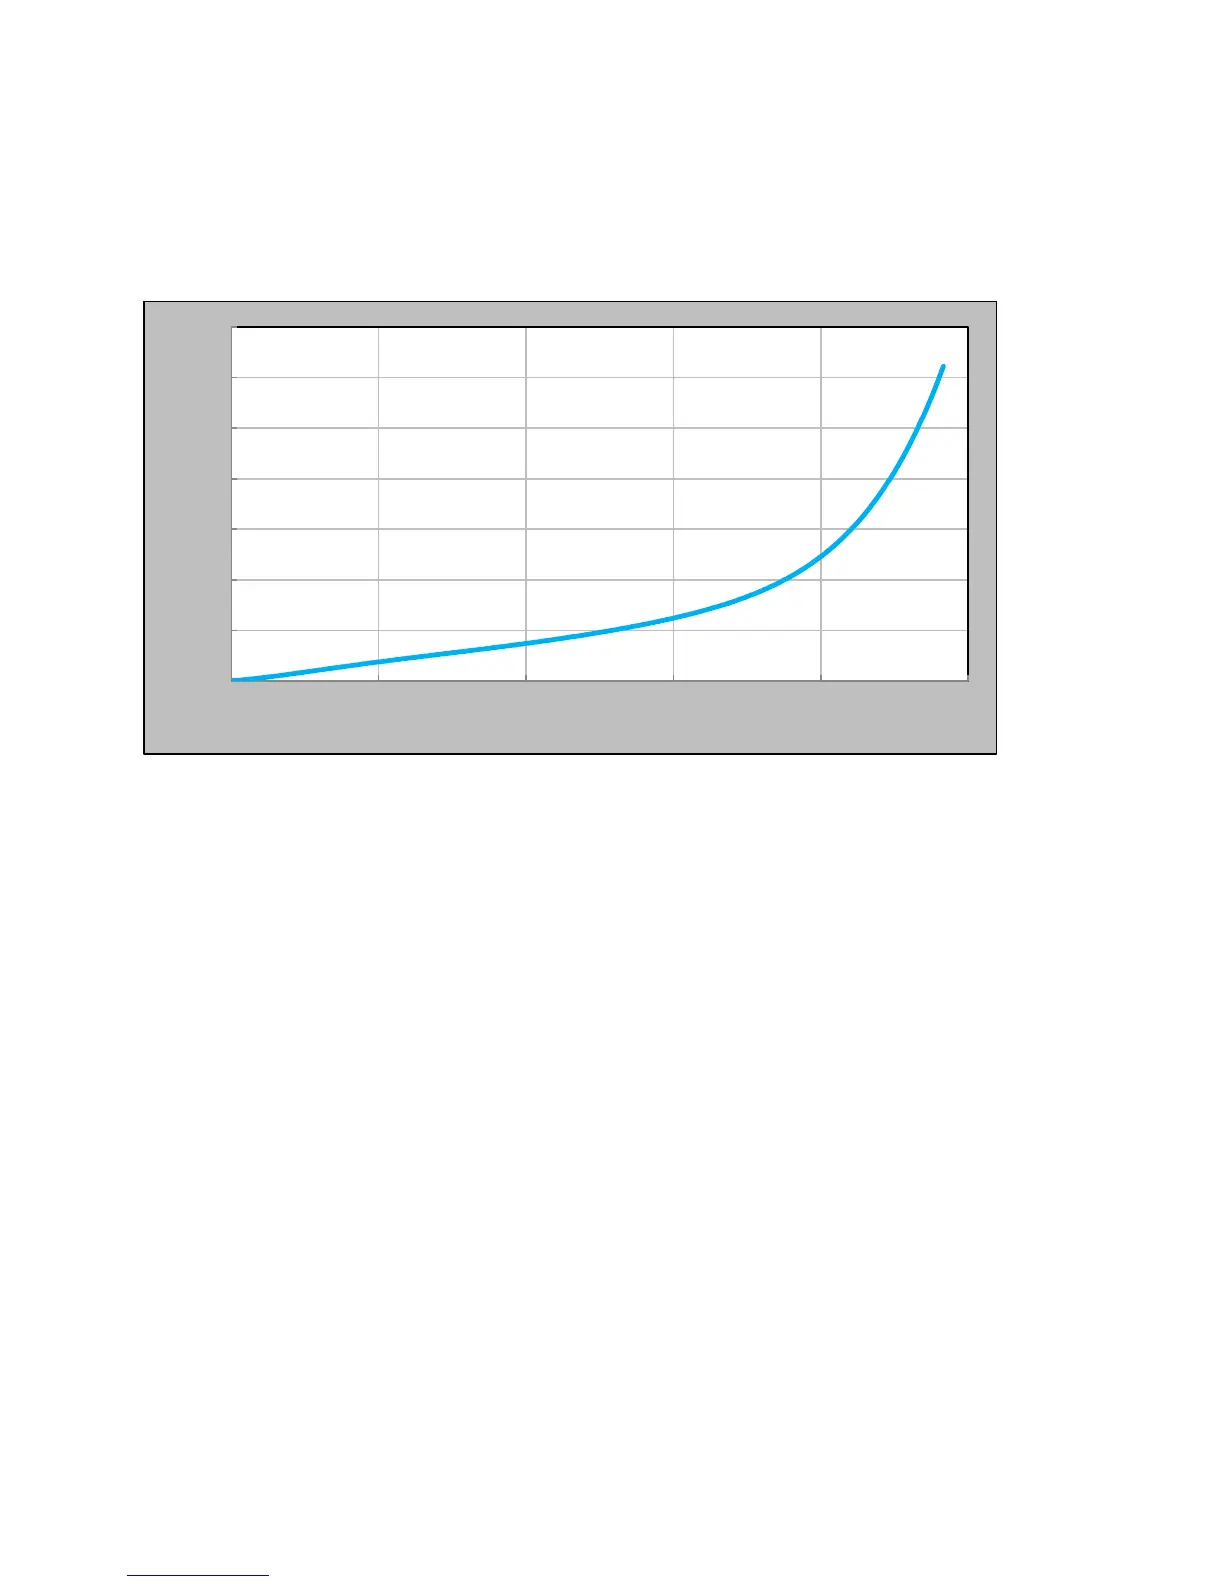
3.1 Pressure Drop
The pressure drop across the system is proportional to the flow through the system.
3.2 Dose Curves
Flow rate, UVT, and required UV dose conditions dictate which system is appropriate
for a given location.
Dose values such as those in the following graphs are calculated based on set-points.
Set-point conditions are determined by third party verified bioassay testing completed in
compliance with the 2006 UV Disinfection Guidance Manual (UVDGM).
Each of the PRO systems has a unique flow restrictor to limit flow rates to 10, 20, and
30 GPM for the PRO10, PRO20, and PRO30 systems respectively. These restrictors
are found in the inlet port of the chamber and physically inhibit flow rates from
exceeding maximum design flow.
0
10
20
30
40
50
60
70
0 20 40 60 80 100
% of Rated System Flow