Vitalograph Spirotrac Instructions for Use
IFU Part No.: 07402
Issue 22
_______________________________________________________________________________________________________________
Page 52 of 78 DT_0006-15
In the analysis view, the software presents an analysis of the QRS complexes of the
ECG section over 10 s, which is visible on the monitor. From this data, it calculates an
average heart cycle, the so-called representative heart cycle. The associated
representative leads, as well as the time and amplitude parameters are displayed.
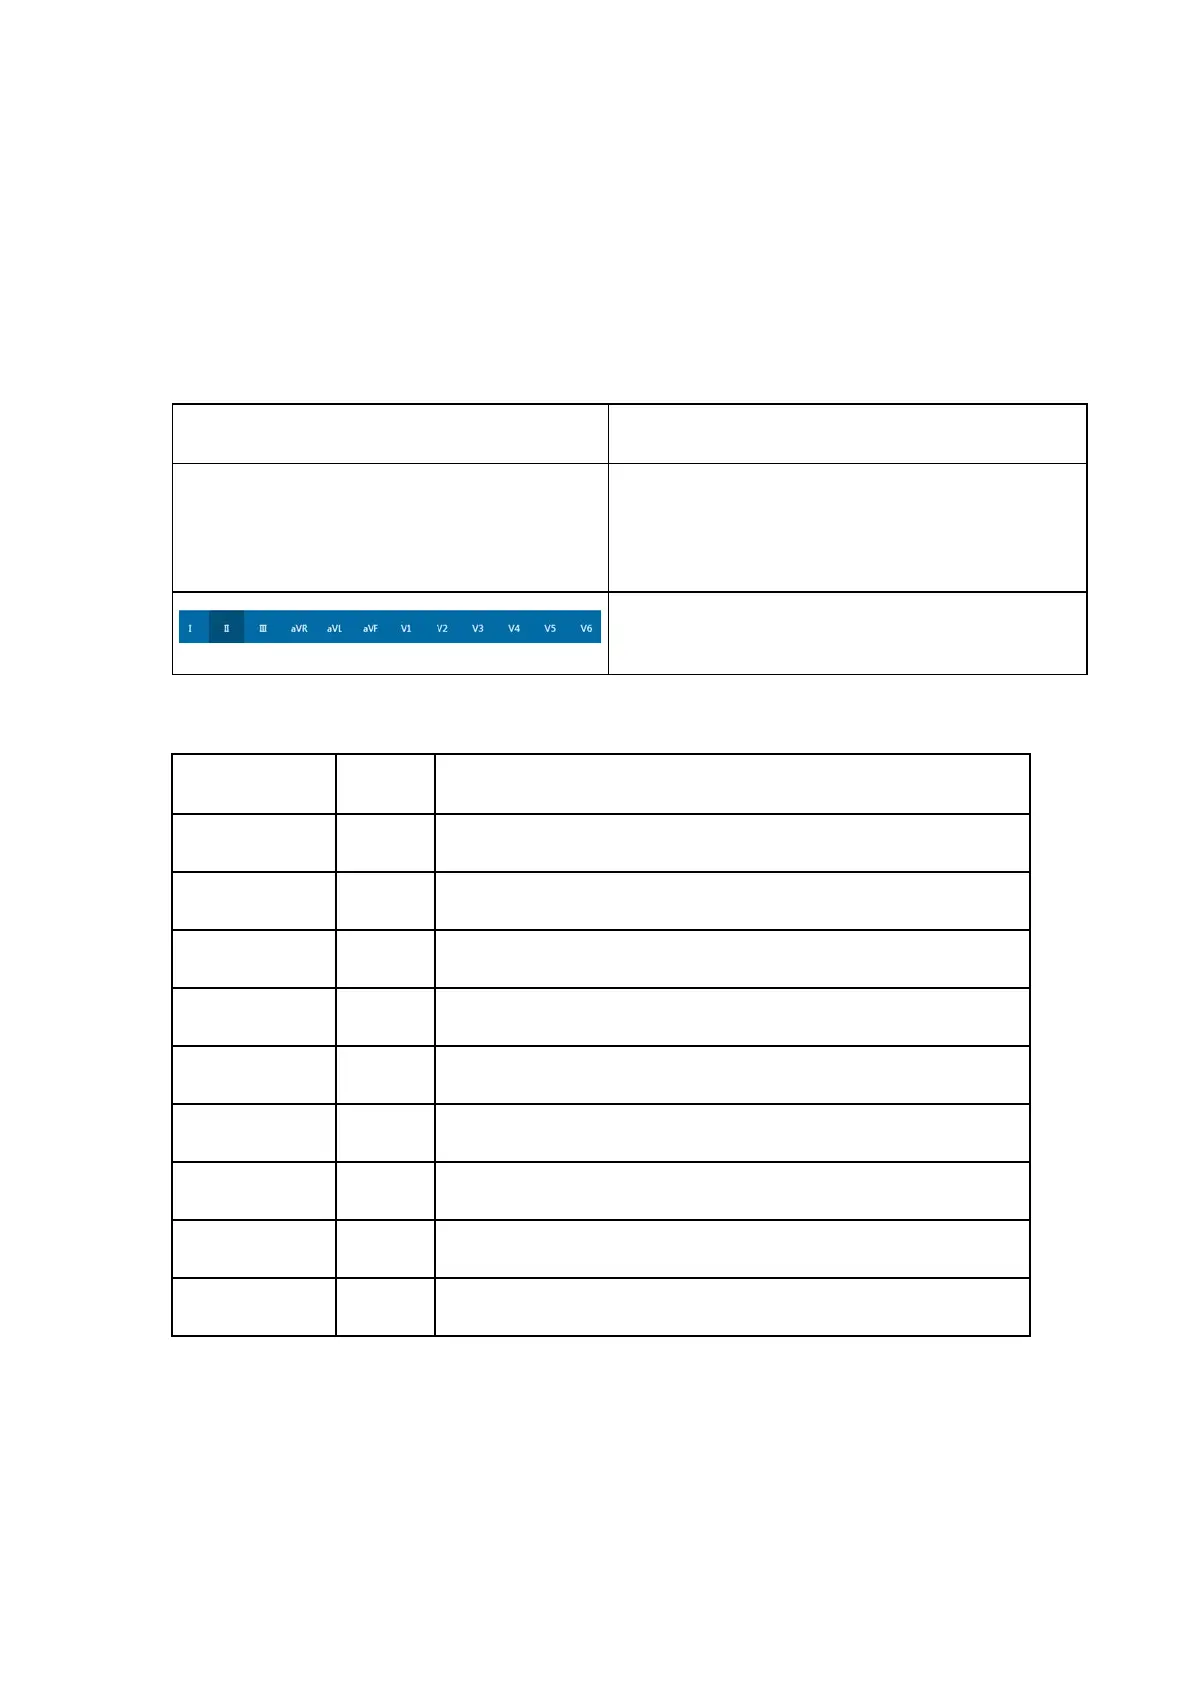
The following functions are available during analysis:
Function Description
Scrolling
Scroll through different time-
using the scroll bar with the mouse. Alternatively,
scroll to the left with the “Page Up” key and to the
right with “Page Down”.
Select which lead is displayed by clicking on the
Lead symbol
Analysis Software functions and description
Parameter Unit Meaning
HR [/min] Heart Rate
RR [ms] R-R interval
P [ms] Duration of the P wave
PQ [ms] Duration of the PQ interval
ST [ms] Duration of the ST segment
PR [ms] Duration of the PR interval
QRS [ms] Duration of the QRS complex
QT [ms] Q-T interval
QTc [ms] Q-T interval, corrected by the heart rate
Parameters
4.6.5 Configure Spirotrac prior to performing an ECG recording
The following settings may be configured through Tools > Options > ECG:
1. Line filter option: choice of 50 or 60 Hz. Default 50.
2. Muscle filter option: choice of On/Off. Default Off.
 Loading...