SonTek, a Xylem brand
RiverSurveyor S5/M9 System Manual (February 2013)
75
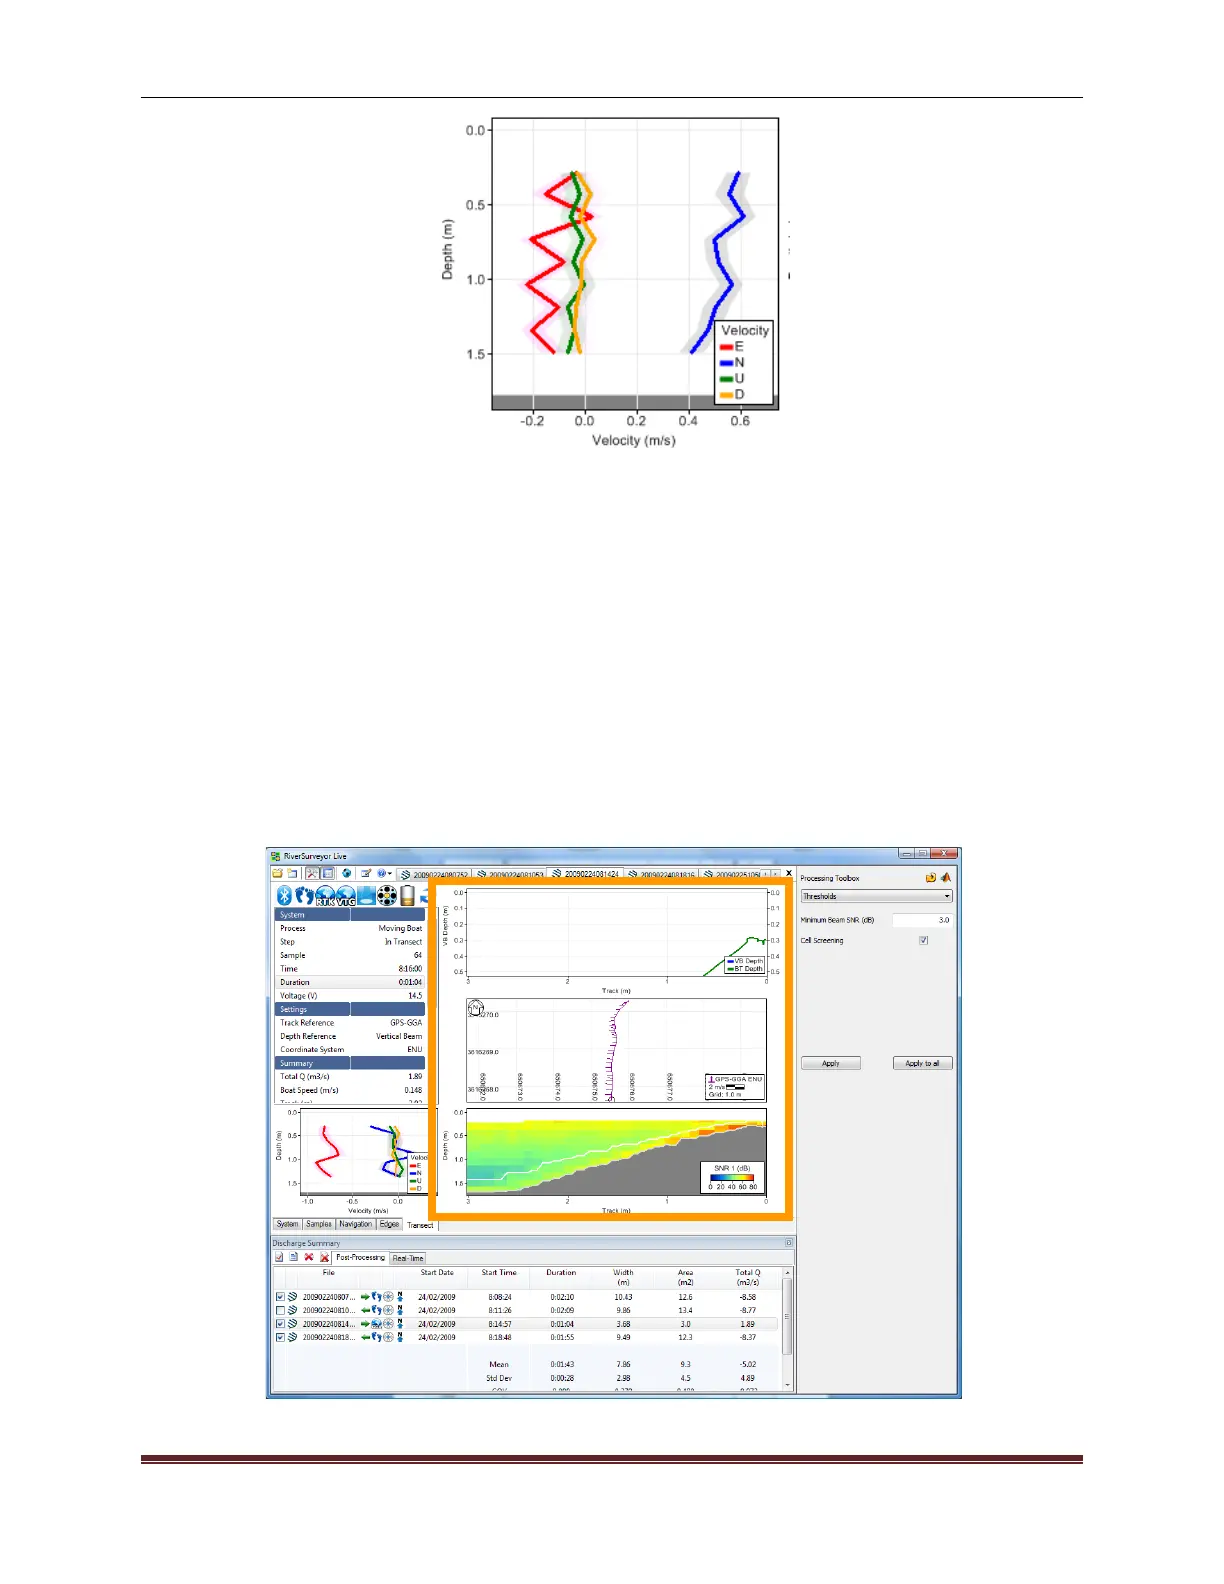
Figure 93. Profile View – WaterTrack
Another useful plot for the profile graph is to select Summary and then Discharge. This will pre-
sent a graph that plots the profile extrapolation with the area under the graph being the incre-
mental discharge for the sample/profile.
8.3.4.
Tab Windows Selection
There are five views or data tabs in the software. Each tab presents a specific view of the data
explained below.
8.3.5.
Tab Window Display
The Tab Window (Figure 94) shows different views of the data as different tabs are selected.
When a tab is selected, it becomes the active tab for all data files which are open in the pro-
gram. The PageUp and PageDown keys can be used to toggle between the tabs. Below is an
explanation of each Tab Window.
Figure 94. Tab Window Display
 Loading...