11
as it is recorded. Any old data will be replaced by newer data as the leader line advances to the
right, each graph completely overwrites every 100 seconds (approx. 1.5 minutes).
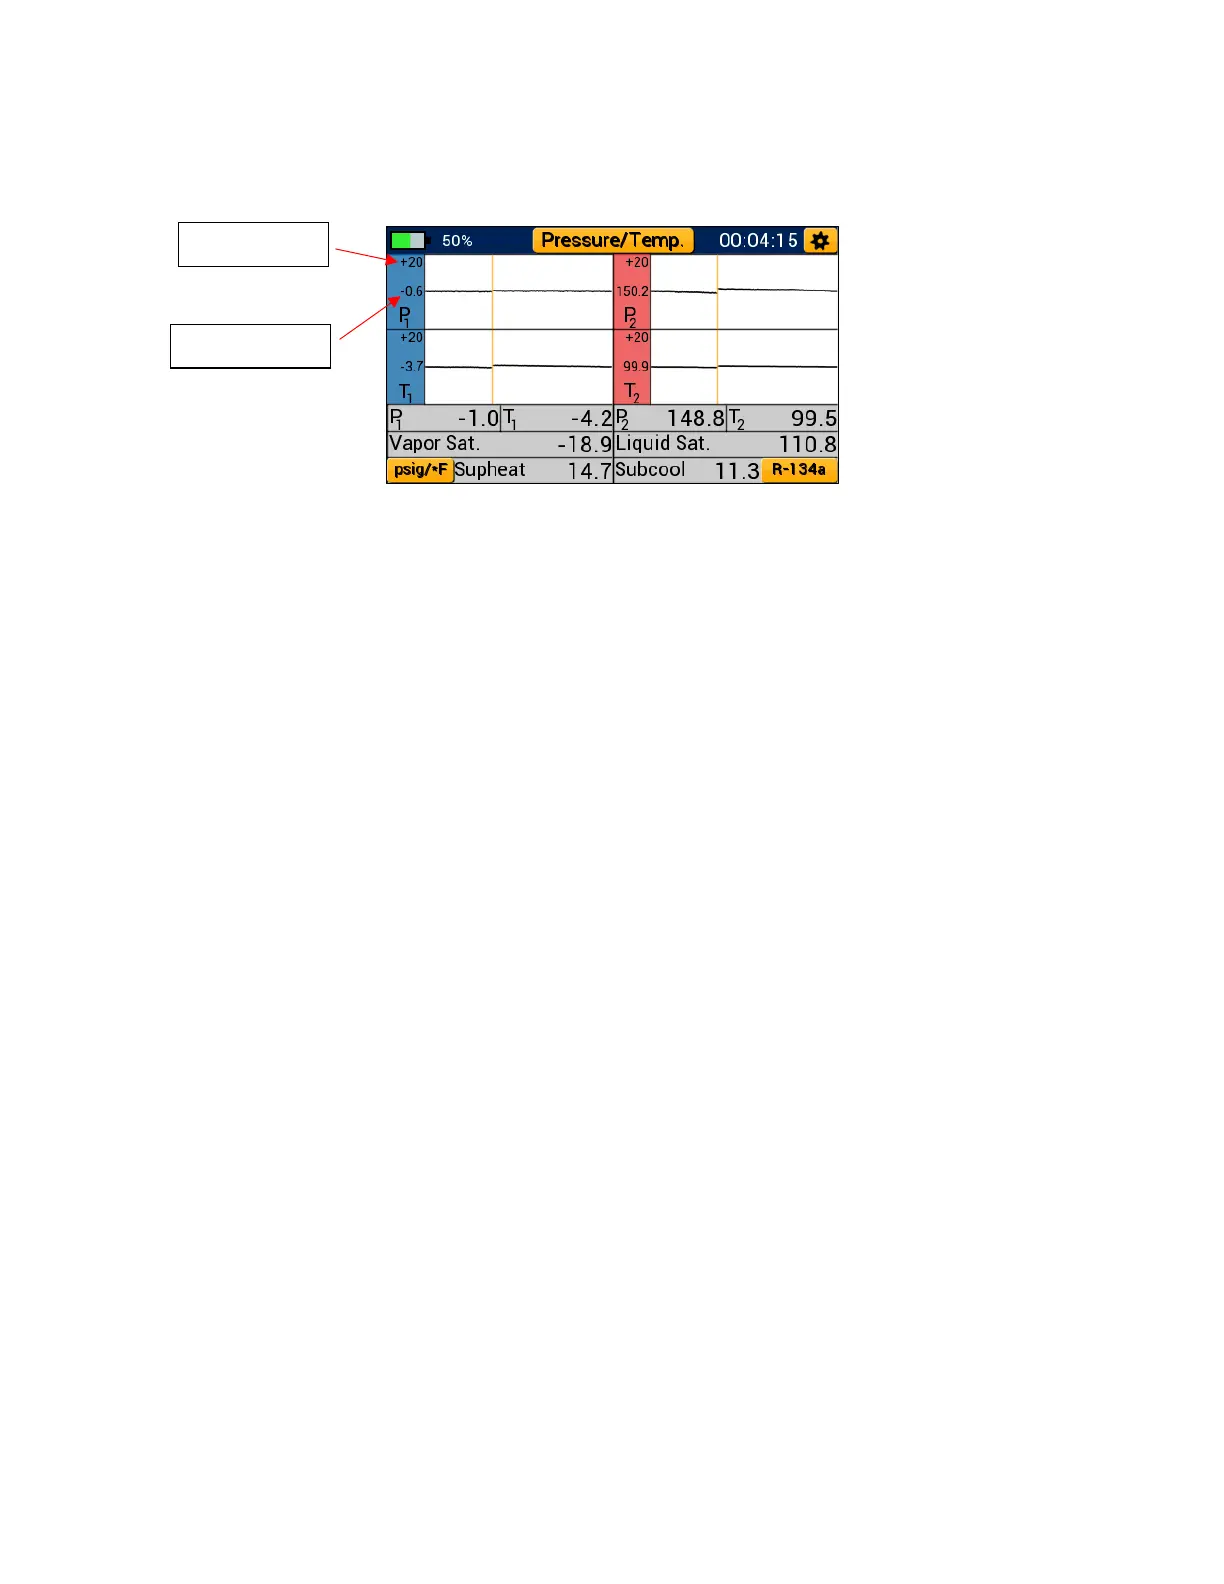
Each line graph centers on the first pressure or temperature measurement recorded when
beginning a new plot, this value is displayed adjacent to the plot line to the left of each graph.
Above this, a scaling value is displayed. The scaling value sets the upper and lower bound of each
graph based on the current central value.
Ex. First Reading = 150.2 psig
Scaling Value = 20 psi
Upper Boundary = 150.2 psig + 20 psi = 170.2 psig
Lower Boundary = 150.2 psig – 20 psi = 130.2 psig
While in line graph format, pressure, system temperature, saturation temperature and calculated
superheat and subcool are displayed in a table format below each set of graphs. Each graph can
be transformed back into a gauge at any time by tapping anywhere within the graph.
Operating Pressure/Temperature Mode:
While on any modes screen (or the modes menu), tap the settings icon in the upper right-hand
corner to access the general settings menu. Additionally, the unit settings and refrigerant settings
menus can be quickly accessed by tapping their respective buttons in the lower left and right-
hand corners respectively (or through the general settings menu). Finally, the modes menu can
be accessed by tapping the modes button at the top center of the display labeled with the current
mode of operation. The session timer displayed in the top right corner of the display begins to
increment the moment pressure/temperature mode is selected. Use the session timer to track
the length of a pressure/temperature session.
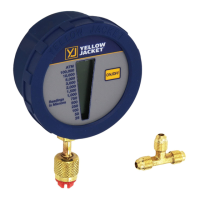
NOTE: Before connecting to the system, make sure to zero the pressure transducers at ambient
pressure to ensure accurate pressure readings. To read about the transducer zeroing process,
see page 20.
Figure 18: Pressure/Temperature Line Graphs