16
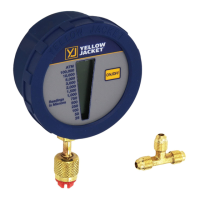
Any old data will be replaced by newer data as the leader line advances to the right, the line
graph will completely overwrite every 200 seconds (approx. 3.5 minutes).
The line graph centers on the first pressure measurement recorded when beginning a new plot,
this value is displayed adjacent to the plot line to the left of the graph. Above this, a scaling value
is displayed. The scaling value sets the upper and lower bound of the graph based on the current
central value.
Ex. First Reading = 163.3 psig
Scaling Value = 20 psi
Upper Boundary = 163.3 psig + 20 psi = 183.3 psig
Lower Boundary = 163.3 psig – 20 psi = 143.3 psig
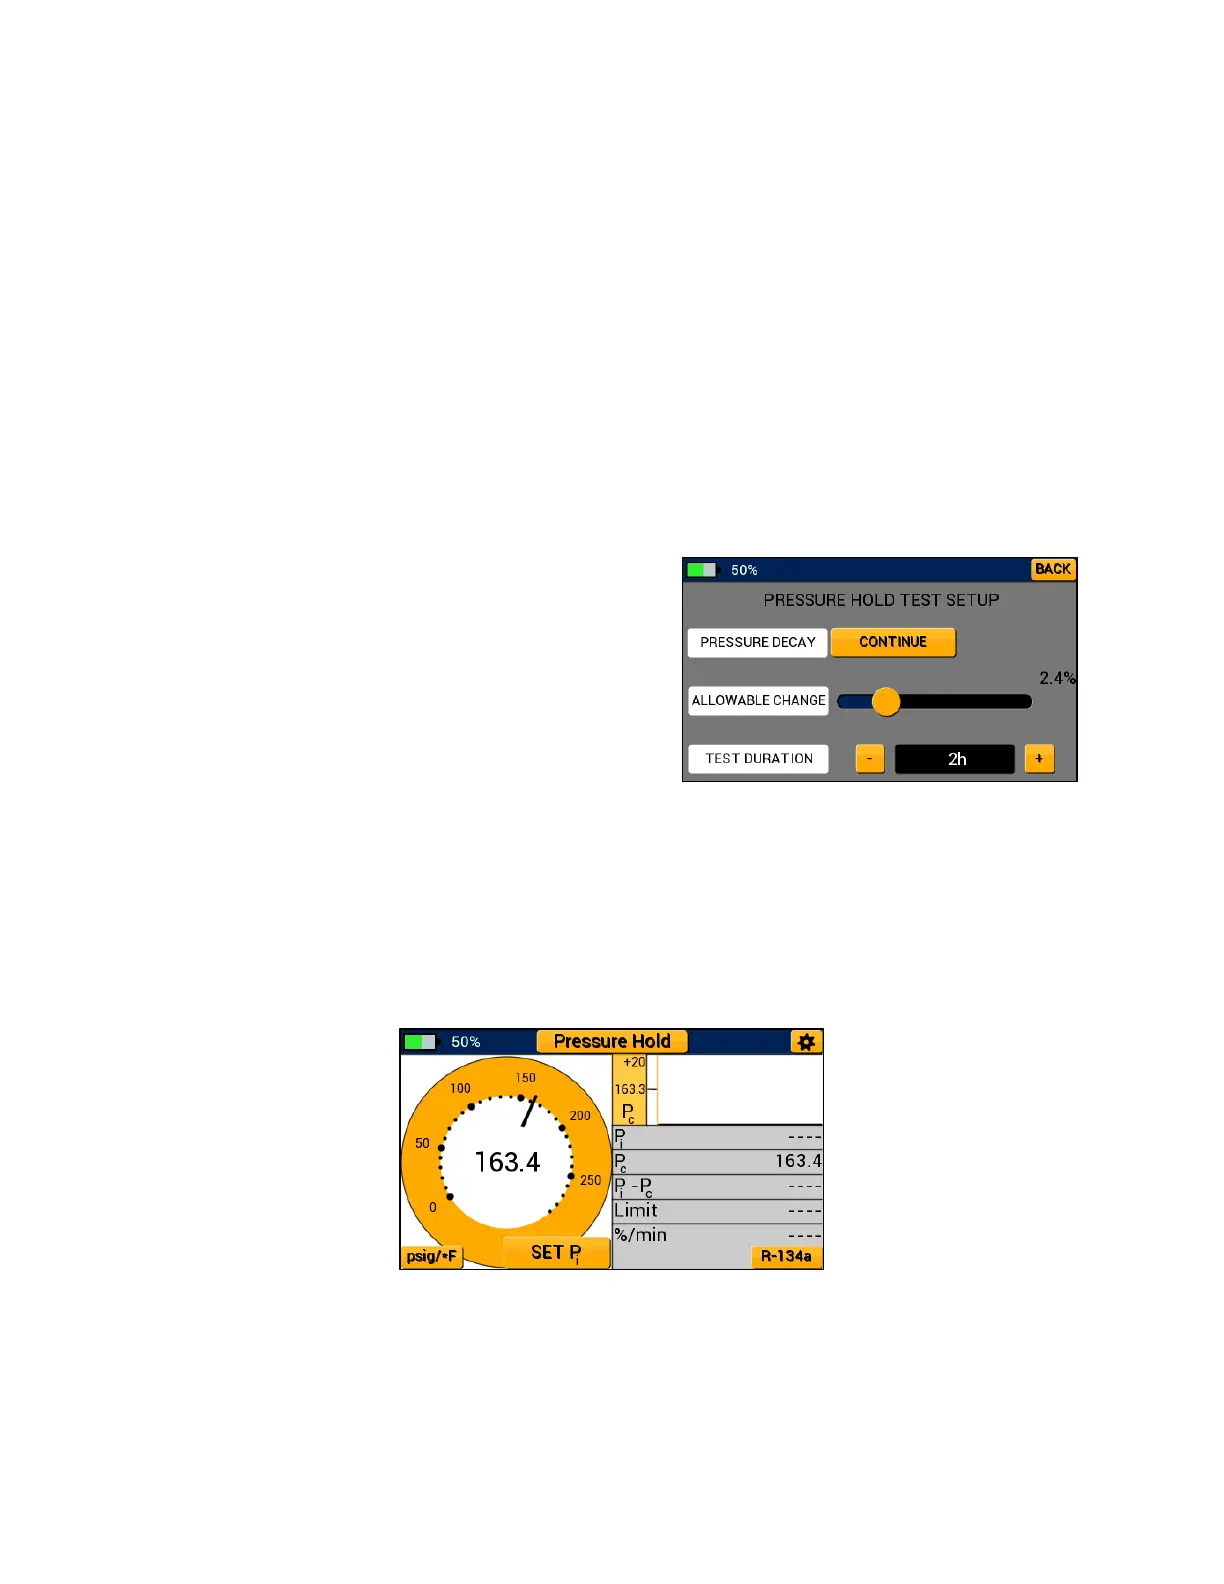
Operating the Pressure Decay Mode:
To conduct a pressure decay test, select “Pressure
Hold” from the modes menu, the device will advance
to the pressure hold test setup menu seen in Figure
22. This menu allows the user to adjust the allowable
change in pressure and pressure decay test duration.
Allowable change is measured as a percent of the
initial system pressure the system can drop before
the P51-870 TITAN® deems the pressure decay test a
failure. To adjust the allowable change percent, drag the slider bar until the desired percent
change is displayed. The test duration sets the length of time the pressure decay test will be
conducted. If the pressure has not dropped below the limit pressure within the test duration, the
P51-870 TITAN® deems the pressure decay test a pass. Tap the + and – buttons to adjust the test
duration value. When all desired settings have been set, select the continue button to advance
to the pressure decay test. The Back button can be used to return to the modes menu.
Ensure the system is properly charged to the desired test pressure and is connected to the
manifold low side transducer. Once the system is ready for the pressure decay test, tap the Set
Pi button to begin the test (shown in Figure 23). The current system pressure will be stored as Pi
and is displayed within the table directly below the pressure decay graph.
Figure 22: Pressure Decay Test Setup Menu
Figure 23: Pressure Decay Test – Set Pi