Dynamic behaviour of the display
• If the MPPT scan function is enabled, icon b9 will be shown on the dis-
play. See conguration in the MPPT settings menu section. This icon will
ash during scanning.
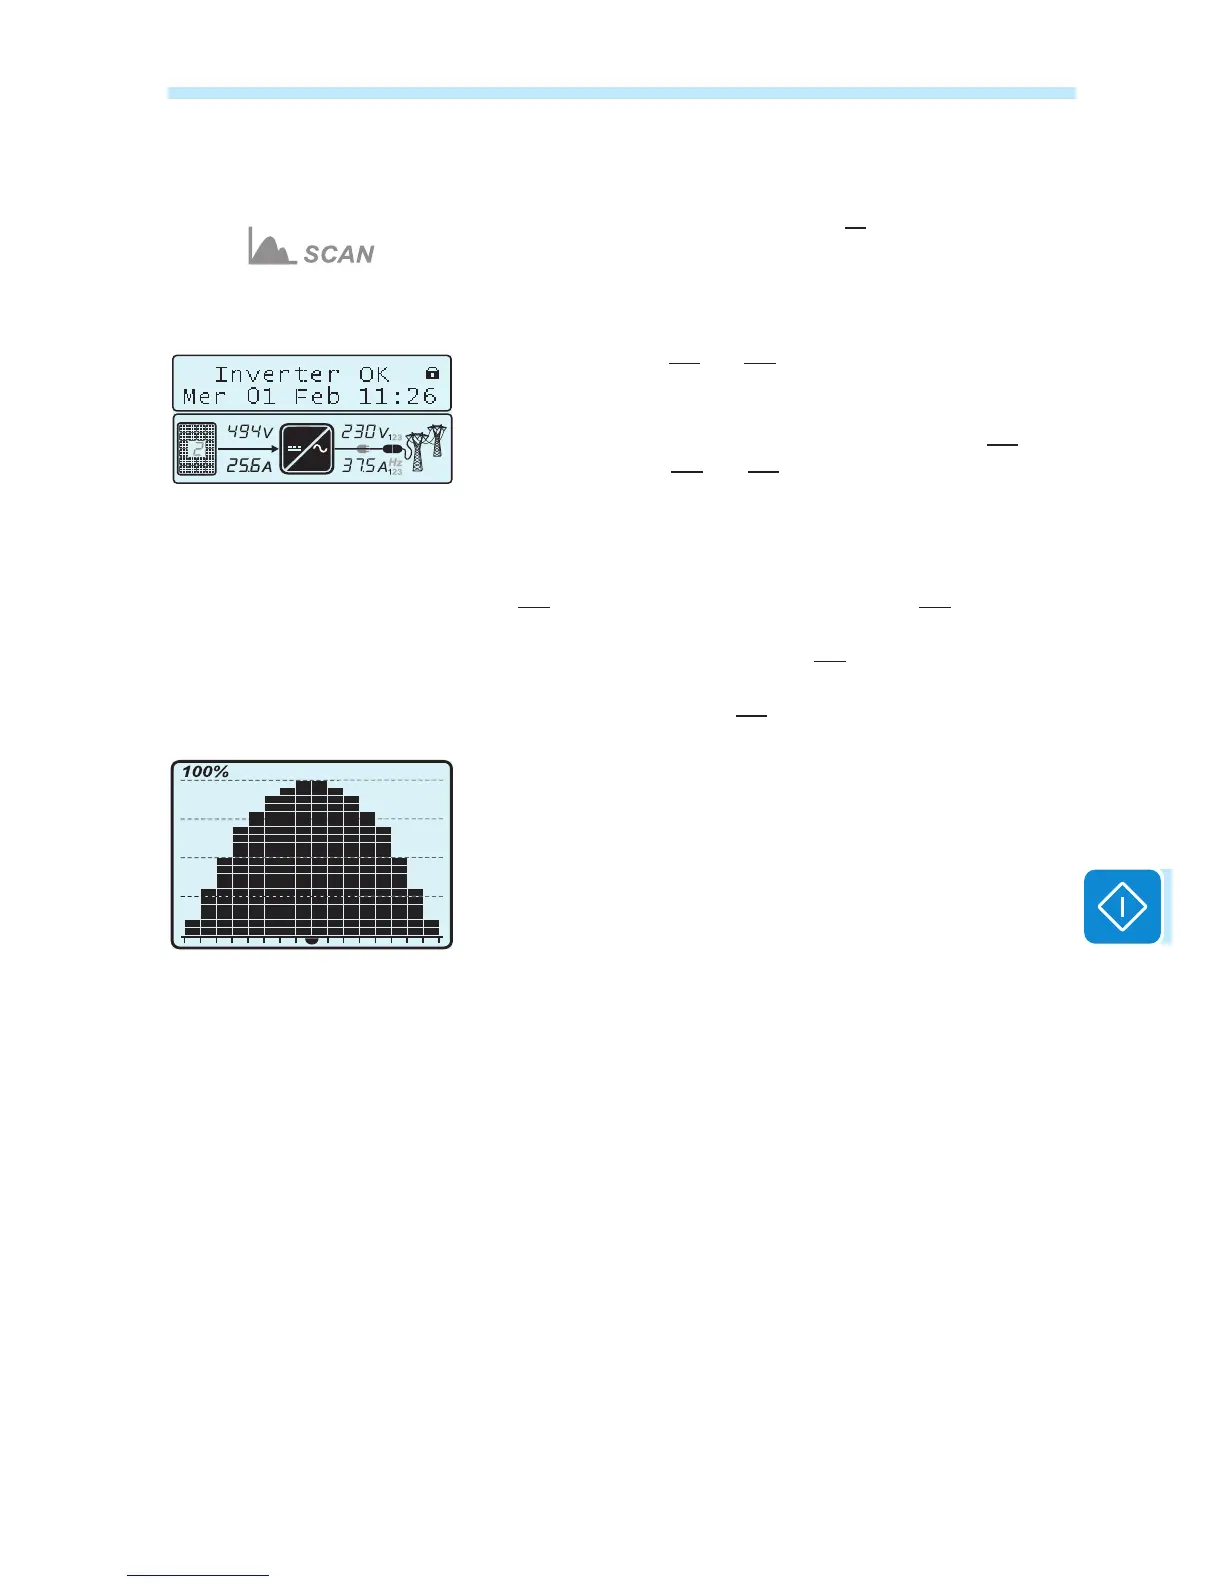
• During operation, the following values are displayed in rotation:
- Voltage and current (b15 and b16) from the PV generator. According
to the conguration or model of the inverter, the voltages and currents of
one or both channels (or of the single strings) will be displayed. The input
channel considered is indicated by the value entered on icon b14.
- Voltage and current (b19 and b20) on the various phases. According
to the model of inverter, the voltages and currents of one (1) or three
phases (1,2,3) will be displayed. The phase considered is shown on the
right side of the voltage and current values.
At the end of the aforesaid display, the grid frequency will be indicated in
eld b20 and the line voltage will be indicated in eld b19.
At the same time, the main readings made by the inverter will be dis-
played in rotation on the graphic display b10.
• Display of the power graph b11
The histogram includes 16 horizontal units and 20 vertical units.
The period of time is represented by the horizontal axis of the graph and
can be set by the user to 8, 16 or 24 hours; therefore, each horizontal unit
can represent 30, 60 or 120 minutes.
The vertical axis represents the maximum power derating and therefore
100% corresponds to this outgoing exported power value.
Finally, bear in mind that the power value expressed by each column of
the graph represents the average value of the power during the period
relating to the horizontal unit.
DC
AC
 Loading...