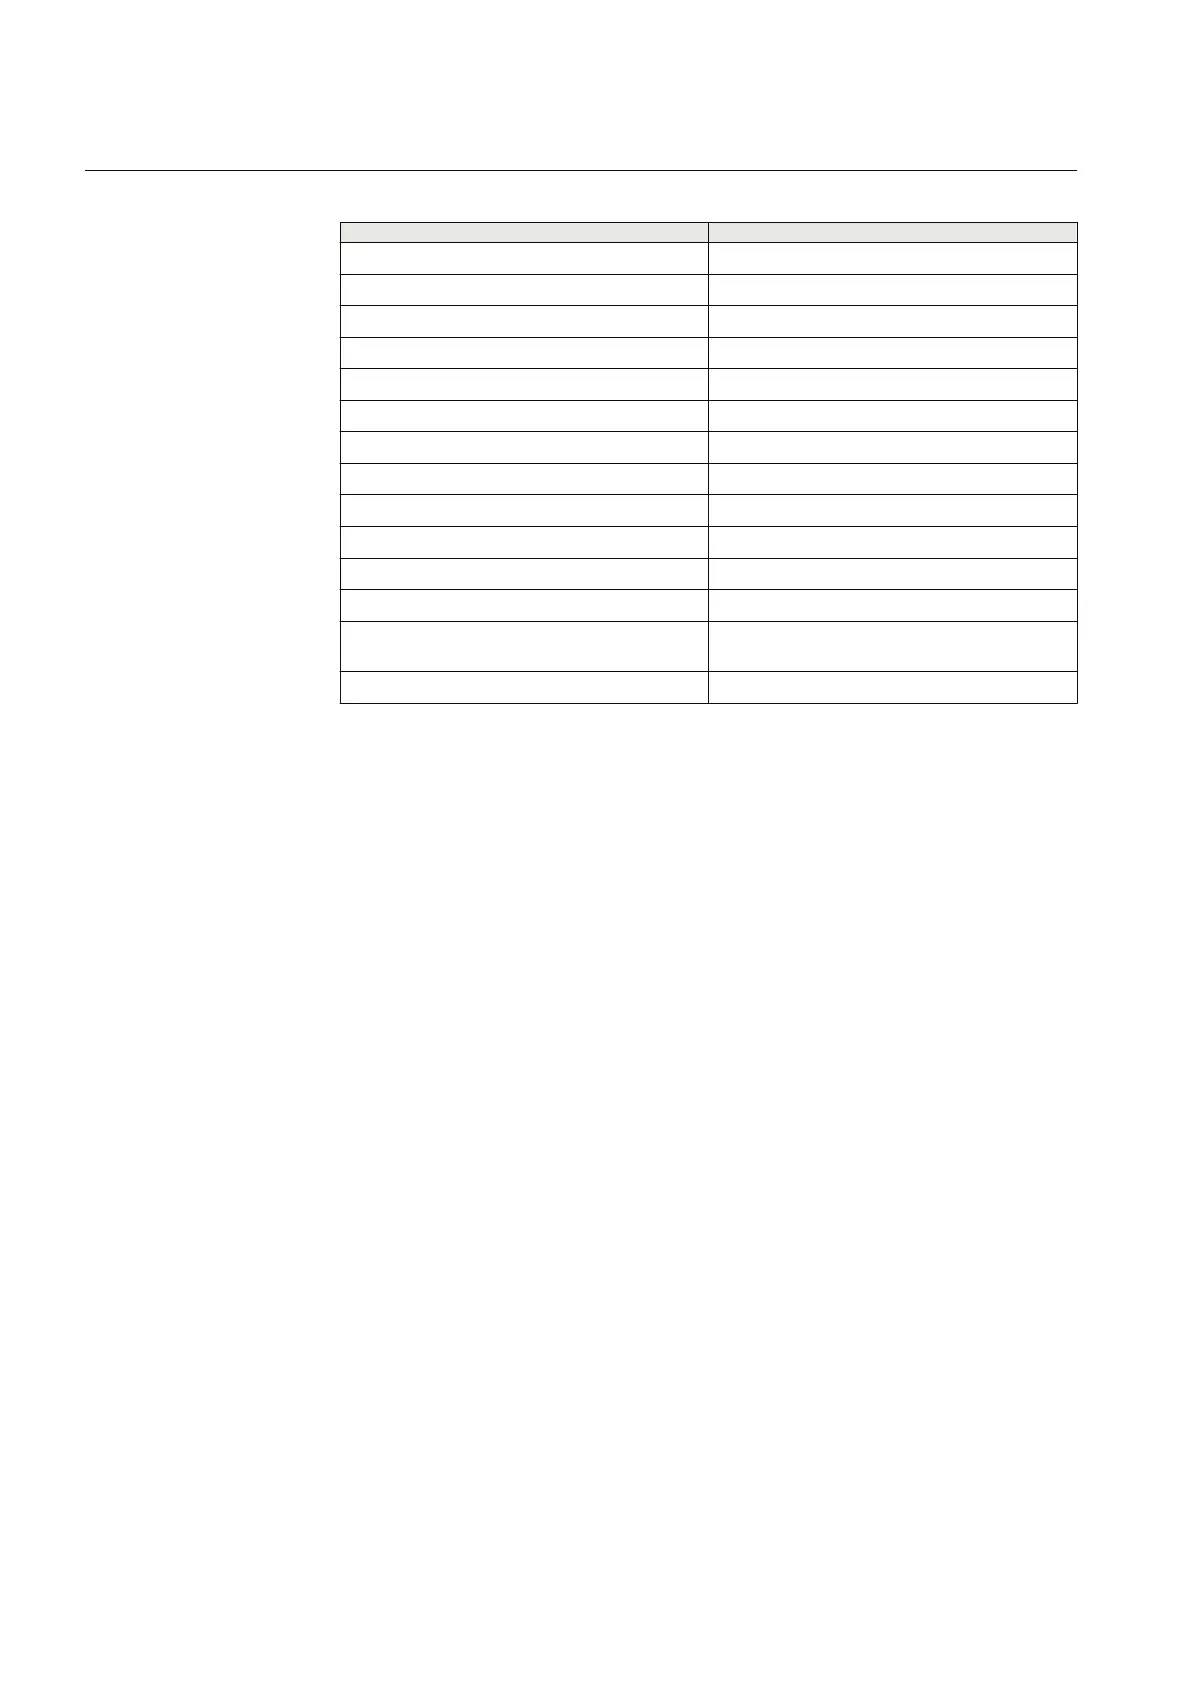
Table 3: Trend diagram control buttons
Name Description
Play Updates screen
Stop Stops screen refreshing
Refresh search Refreshes the display
Zoom Zooms the display
Rezoom Reduces the display
Zoom - Reduces the display's time intervals
Zoom + Increases the display's time intervals
Cursor on/off Queries values
<< Scrolls backward on the time axis (history)
>> Scrolls forward on the time axis (current)
Copy to clipboard Copies representation into the intermediate store
Diagram Display of set filter
Settings Opens the dialog box for diagram settings and
cursor output
Print Prints diagram
The diagram pane displays the trend curve and the cursor output list shows the cursor
position in the diagram window, the values set in the diagram settings and the cursor
output.
Variable information is given as a list of curves that can be edited in Runtime.
• Active
• Color
• Area display
• Fill color
• Curve name
• Sorting order
• Title
• Transparency fill color
• Variable name
• Variable identification
• Y-axis
The extended trend functionality supports free curve settings, linear or logarithmic
display, free zooming and scrolling, transparency levels for curve filling, configurable
axes, grid display, interpolated display and surface display also for non-equidistant
values. Trends can be copied as a vector graphic and printed locally or in the network
by means of the print function.
Scrolling in the extended trend provides a ruler and zoom function together with a
trend analysis. To analyze important sections very precisely, the trend needs to be
stopped and the desired area must be highlighted with two cursors. The values are
Section 2 2NGA000149 A
ABB ZEE600 overview
14 ABB ZEE600
Operation Manual