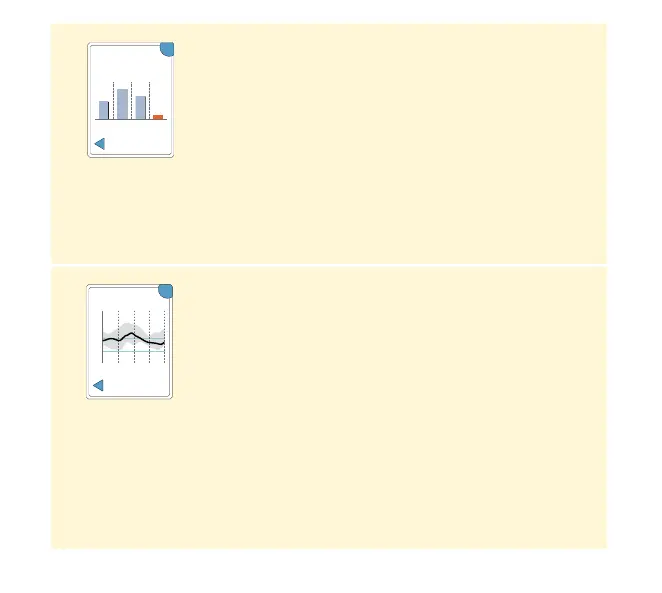
Average Glucose
Information about the average of your Sensor
glucose readings. The overall average for the time
is displayed above the graph. The average is also
shown for four dierent 6-hour periods of the day.
Readings above or below your Target Glucose
Range are orange, while readings in range are blue.
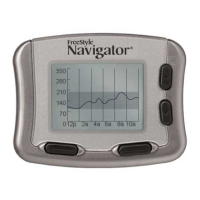
Daily Patterns
A graph showing the pattern and variability of your
Sensor glucose over a typical day. The thick black
line shows the median (midpoint) of your glucose
readings. The gray shading represents a range
(10-90 percentiles) of your Sensor readings.
Note: Daily Patterns needs at least 5 days of
glucose data.
OK
Last 7 Days
12
am am ampm pm
6 12 6 12
121
152
134
Average:
119 mg/dL
69
Average Glucose
12
am
6
am
12
pm
6
pm
12
am
350
250
150
50
OK
Daily Patterns
(mg/dL)
Last 7 Days
111