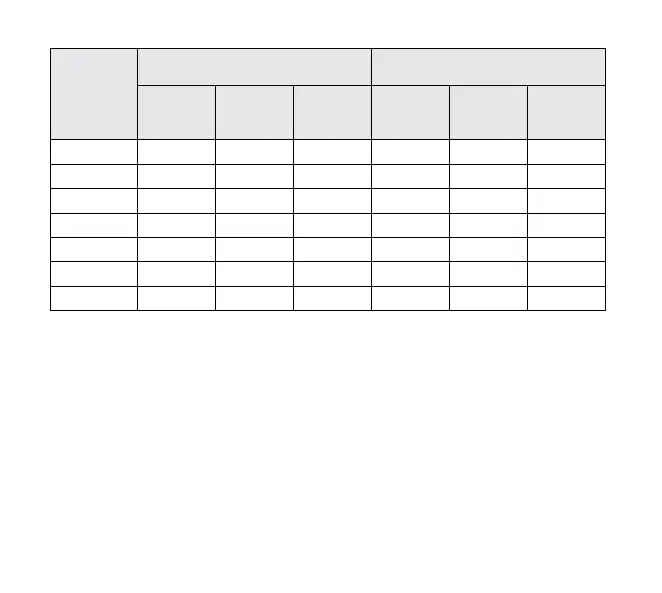
Table 5d: High Glucose Alarm Performance (Pediatric*; n=129)
High Glucose
Alarm level
(mg/dL)
Alarm Rate Detection Rate
Number of
Events (n)
True Alarm
Rate
(%)
False Alarm
Rate
(%)
Number of
Events (n)
Correct
Detection
Rate (%)
Missed
Detection
Rate (%)
120 34176 98.8 1.2 4441 98.2 1.8
140 30107 98.0 2.0 3945 98.4 1.6
180 22430 98.4 1.6 3125 98.0 2.0
200 19425 98.0 2.0 2791 98.0 2.0
220 16371 98.2 1.8 2492 96.9 3.1
240 13559 98.0 2.0 2172 95.7 4.3
300 6064 90.8 9.2 962 91.0 9.0
*
Includes children 6-17 years of age. No YSI measurements were obtained for children 4-5 years of age.
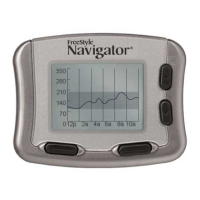
Sensor Accuracy Over Time
The Sensor can be worn for up to 14 days. The percentage of System readings within YSI values and
the Mean Absolute Relative Dierence (MARD) is presented for the following dierent wear periods
in Tables 6a and 6b: Beginning (Adult: 144 Subjects, Day 1, 2 or 3; Pediatric: 48 Subjects, Day 1
or 2) Early Middle (Adult: 91 Subjects, Day 7 or 8; Pediatric: 50 Subjects, Day 7 or 8), Late Middle
(Adult: 55 Subjects, Day 9 or 12; Pediatric: 51 Subjects, Day 9 or 12), and End (Adult: 76 Subjects, Day
13 or 14; Pediatric: 51 Subjects, Day 13 or 14). For values 70 mg/dL and above, the percentage of
readings within 15%, 20%, and 40% of the YSI value was calculated. For values below 70 mg/dL, the
percentage of readings within 15 mg/dL, 20 mg/dL, and 40 mg/dL of the YSI value was calculated.
205