Note:
• A Sensor can store up to 8 hours of glucose data, so scan it at least
once every 8 hours to capture all of your available glucose data.
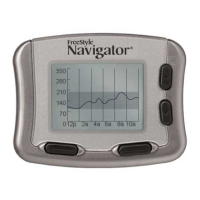
• The graph will scale to 400 mg/dL to accommodate glucose
readings above 350 mg/dL.
• The symbol may appear, indicating the smartphone’s time was
changed. Gaps in the graph may result or glucose readings may be
hidden.
• All available glucose data is used to make your graph so you
can expect to see some dierences between the graph line and
previous current glucose readings.
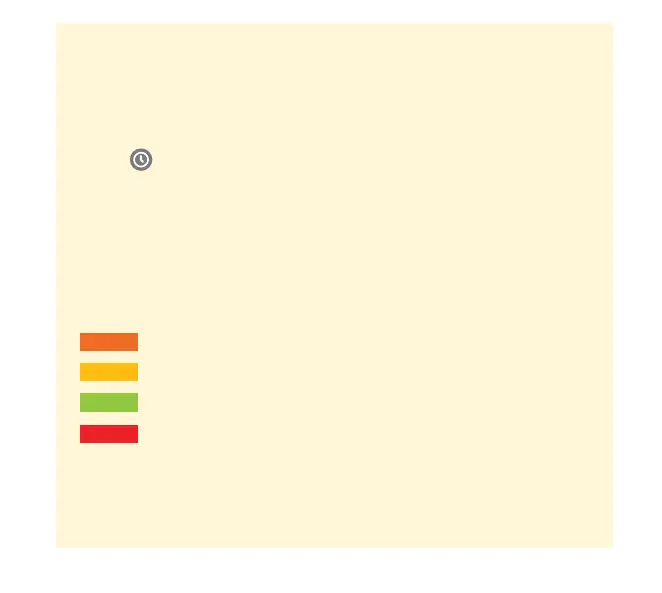
• Your current glucose value determines the background color on the
My Glucose screen:
Orange - High glucose (above 240 mg/dL)
Yellow - Between the Target Glucose Range and high or low glucose level
Green - Within the Target Glucose Range
Red - Low glucose (below 70 mg/dL)
50