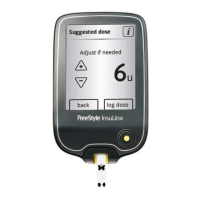
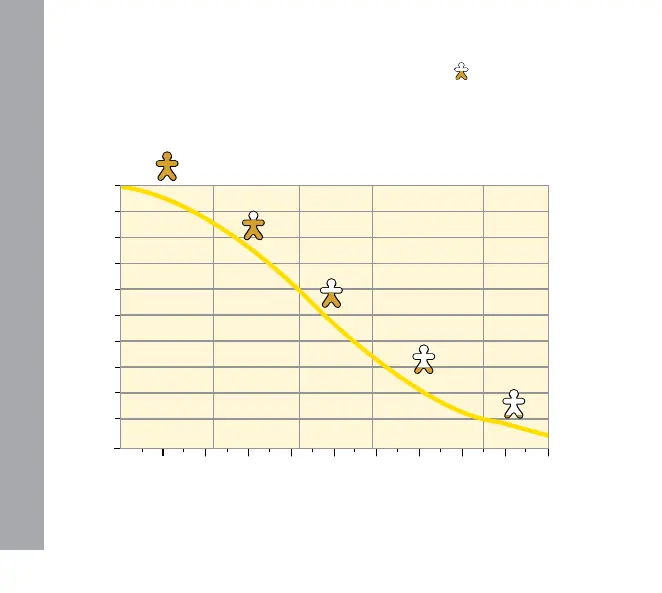
This graph shows how the insulin calculator estimates the amount of
active insulin as a function of logged insulin dose and insulin duration
over time. It also shows the relationship between the
symbol and
amount of active insulin.
10 20 30 40 50 60 70 80 90 100
100
0
90
80
70
60
50
40
30
20
10
Active insulin curvilinear model
% insulin duration
% active insulin
Adapted from Mudaliar et al. Diabetes Care, Volume 22(9), Sept 1999, pp 1501-1506
Professional Options
113