OK
34%
54%
12%
Time In Target
Above
In Target
Below
Target Range
4.4-7.8 mmol/L
Last 7 Days
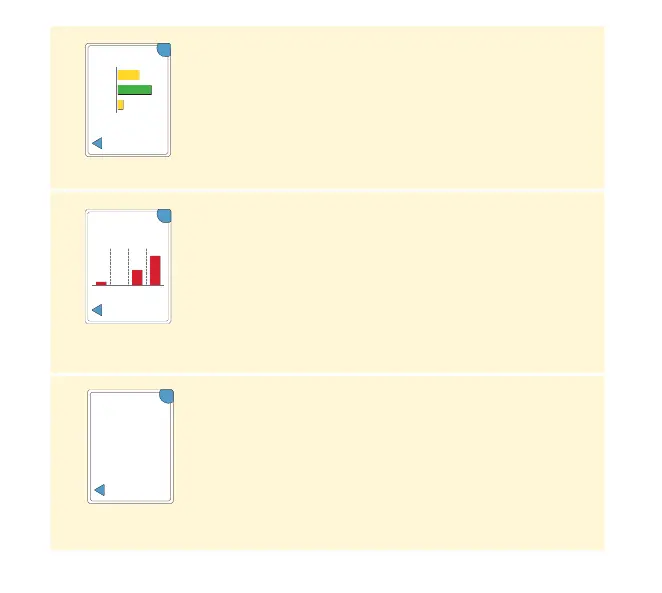
Time In Target
A graph showing the percentage of time your
Sensor glucose readings were above, below, or
within your Target Glucose Range.
OK
Last 7 Days
12
am ampm
12 12
1
0
Total Events:
10
3
6
Low Glucose
Events
Low Glucose Events
Information about the number of low glucose
events measured by your Sensor. A low glucose
event is recorded when your Sensor glucose
reading is lower than 3.9 mmol/L for 15 minutes or
longer. The total number of events is displayed
above the graph. The bar graph displays the low
glucose events in four dierent 6-hour periods of
the day.
Sensor Usage
Information about how often you viewed
your Sensor glucose readings and how much
information has been captured from your Sensor.
OK
100%
5
Views Per
Day
Time Sensor
is Active
Sensor Usage
Last 7 Days
47