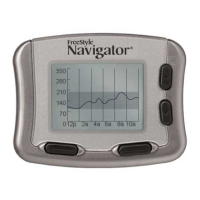
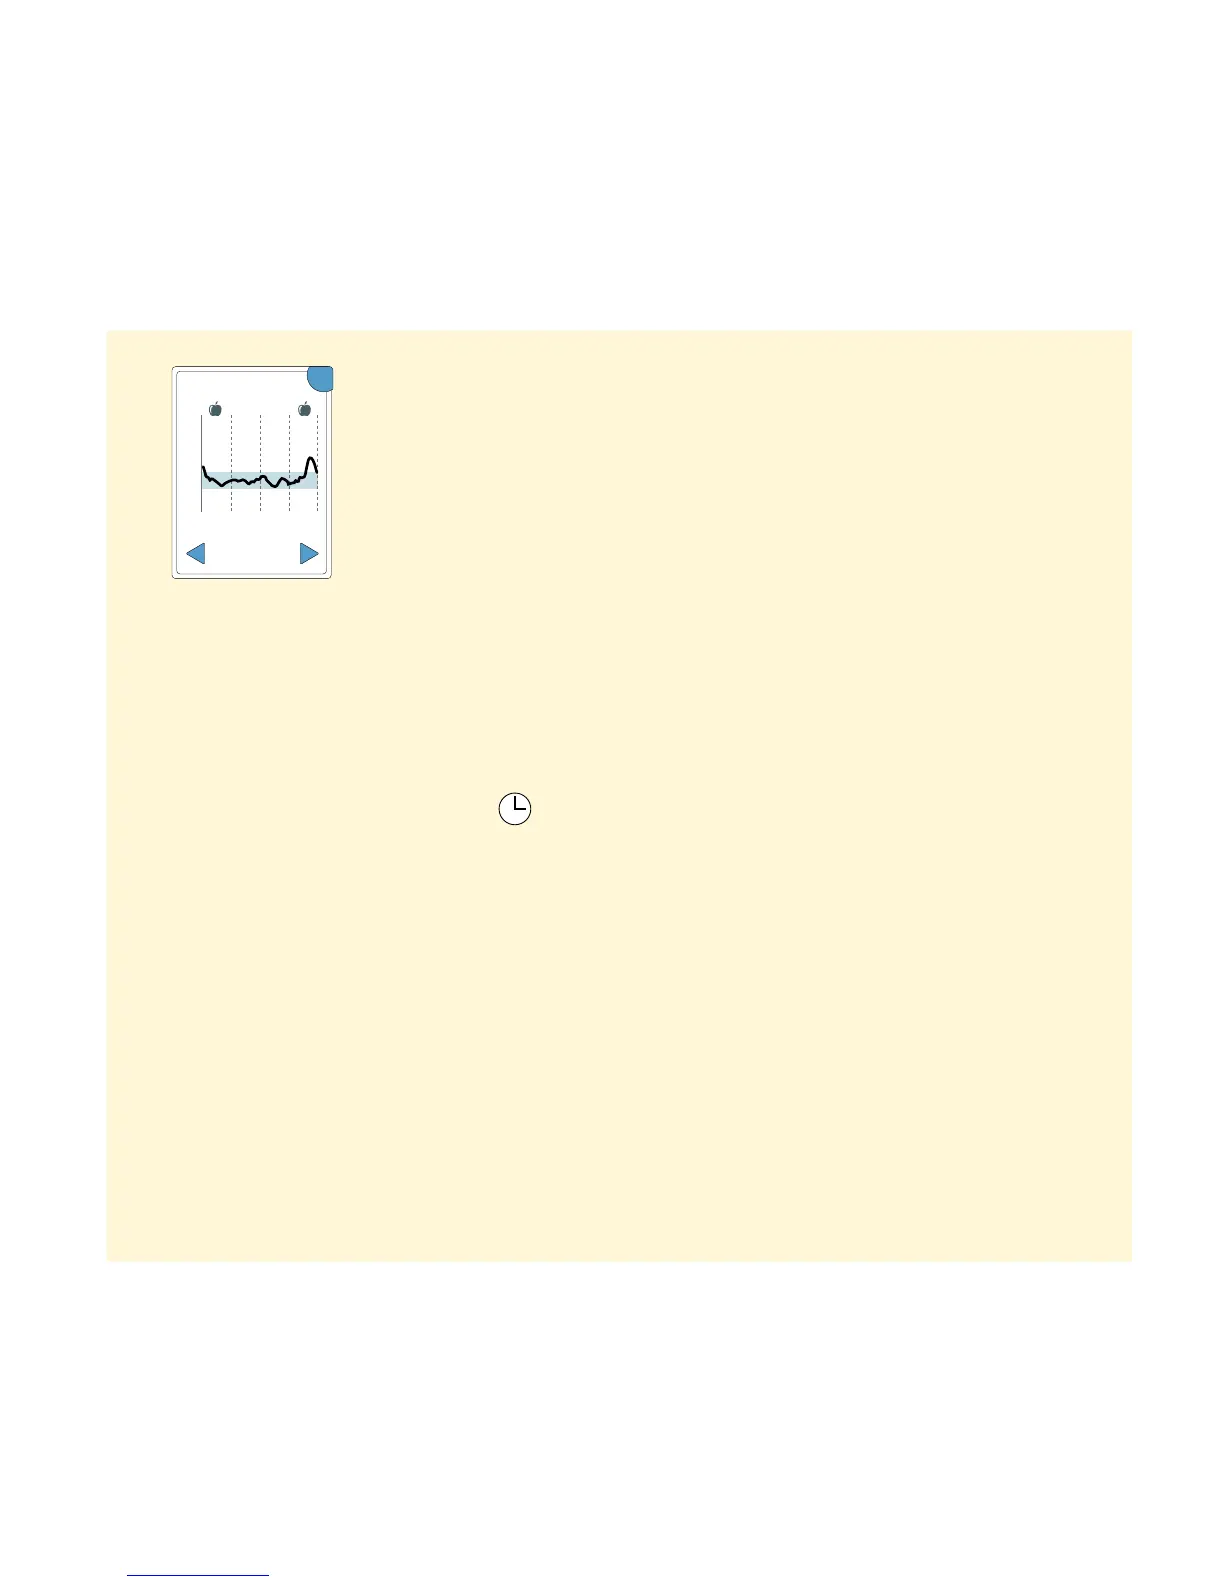
Daily Graph
A graph of your Sensor glucose readings by day.
The graph shows your Target Glucose Range and
symbols for food or rapid-acting insulin notes you
have entered.
Notes:
• The graph displays glucose readings up to
21 mmol/L. Glucose readings above 21 mmol/L
are displayed at 21 mmol/L.
• You might see gaps in the graph during
times when you have not scanned at least
once in 8 hours.
• The symbol may appear indicating the
Reader time was changed. Gaps in the graph
may result or glucose readings may be hidden.
21
15
9
3
00:00 12:00 24:00
OK
Daily Graph
(mmol/L)
22 Feb
Wednesday
34