Performance Tests 2
E4416A/E4417A Power Meters Service Guide 25
12 Take a measurement:
Wait 30 seconds to allow the power level to settle, then press on
the power meter.
13 Record the values displayed on both the power meter and DVM displays.
Note down the values in Table 2- 2.
14 Repeat step 13 a further 49 times to obtain a set of 50 pairs of measured
values.
15 Calculate the measurement error for each pair of measured values using the
following equation:
%
Note down each x value in the Error Value (x) column of Table 2- 2.
16 Calculate the linear standard deviation of the data using Equation 2- 1:
Standard Deviation, where n = number of samples (50) and x = calculated
error values (listed in the Error Value (x) column of Table 2- 2)
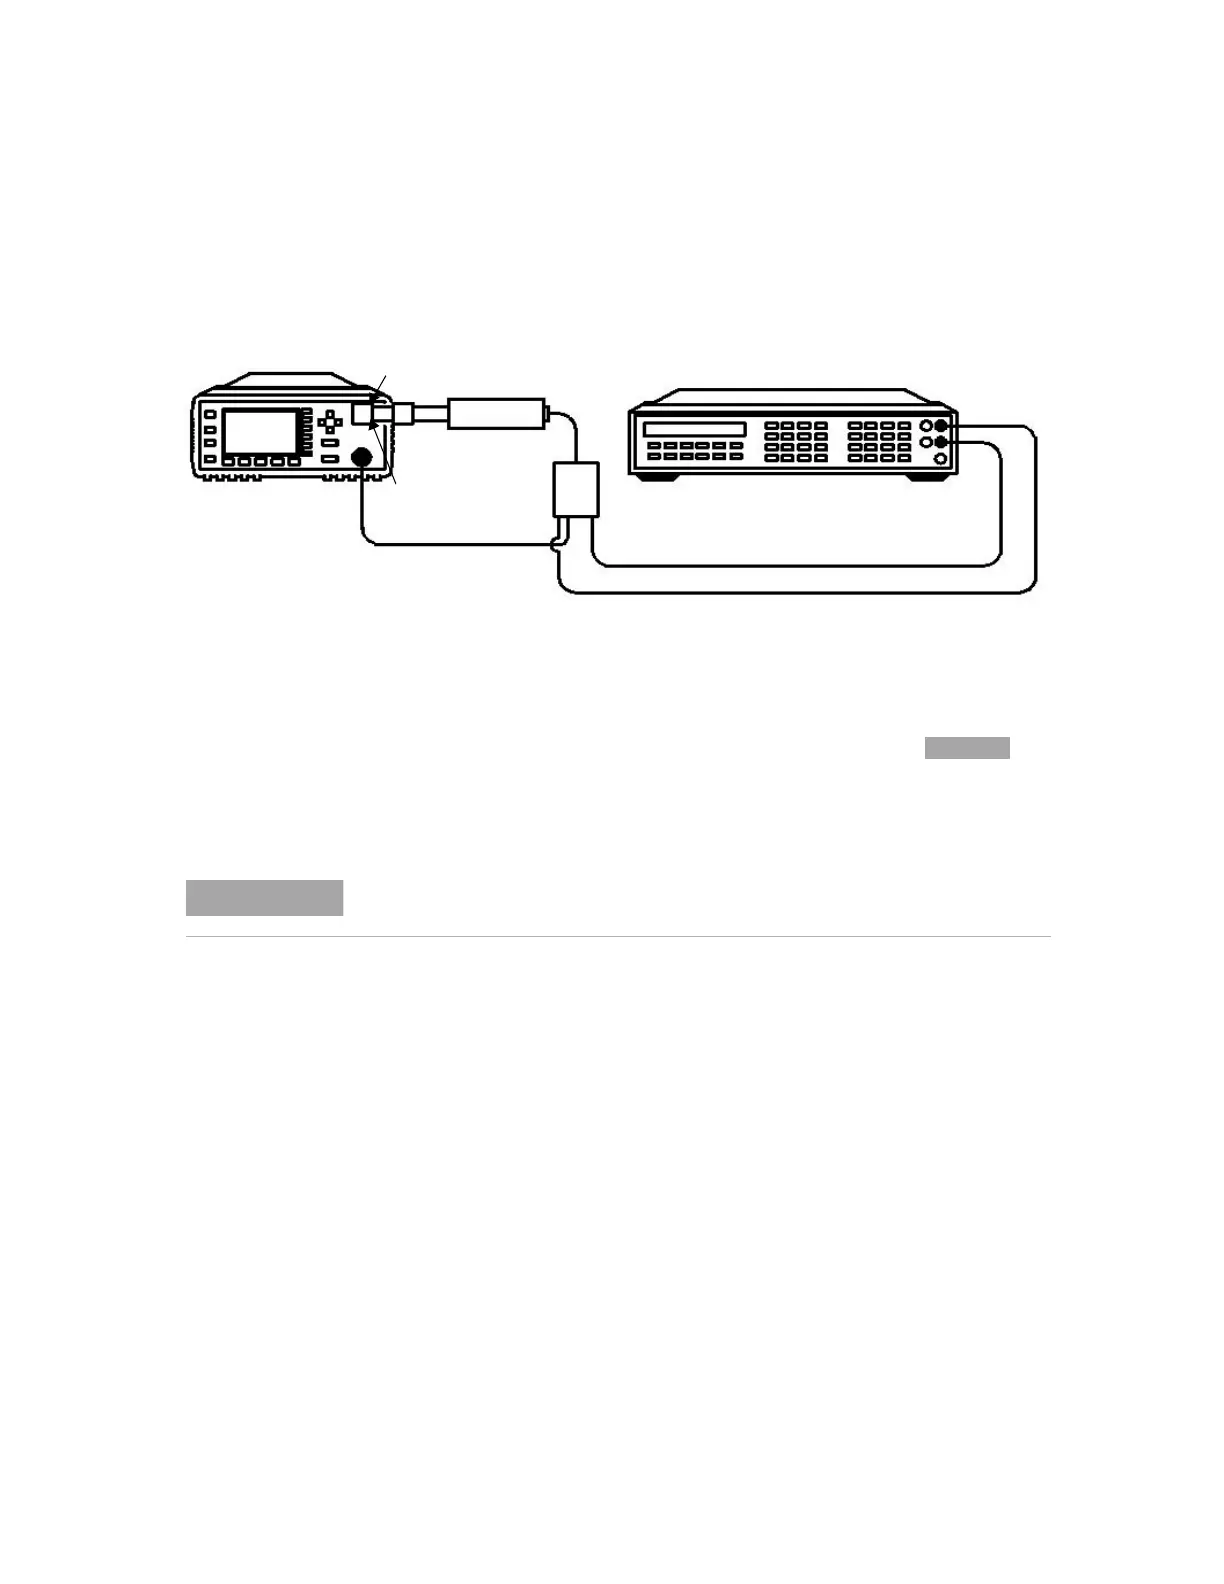
Figure 2-3 Test Setup With Attenuator Connected
Digital Voltmeter
+ input
black
red
Breakout box
Power Sensor
Power Meter
CHANNEL A
Power ref
Power sensor cable
Power sensor cable
Attenuator
− input
These values tend to drift. They must therefore be recorded simultaneously or with as
small a delay as possible between them.
x
DVMValue PowerMeterValue–()
DVM Value
-----------------------------------------------------------------------------------------
⎝⎠
⎛⎞
100×=
Artisan Technology Group - Quality Instrumentation ... Guaranteed | (888) 88-SOURCE | www.artisantg.com
 Loading...