Publication 1746-UM022B-EN-P - January 2005
Module Specifications A-7
The diagrams that follow for each thermocouple type give data for a
sample module over the input range of the thermocouple over
temperature. Thermocouples are usually parabolic in their µV to °C
curves. Normally, at the ends of any given thermocouple range, the
ratio of change in temperature increases as a result of a change in
voltage. In other words, at the ends, a smaller change in voltage
results in a larger change in °C. The data that follows gives an idea of
a sample module’s error over the thermocouple range, versus at a
single reference point as provided with the tables above.
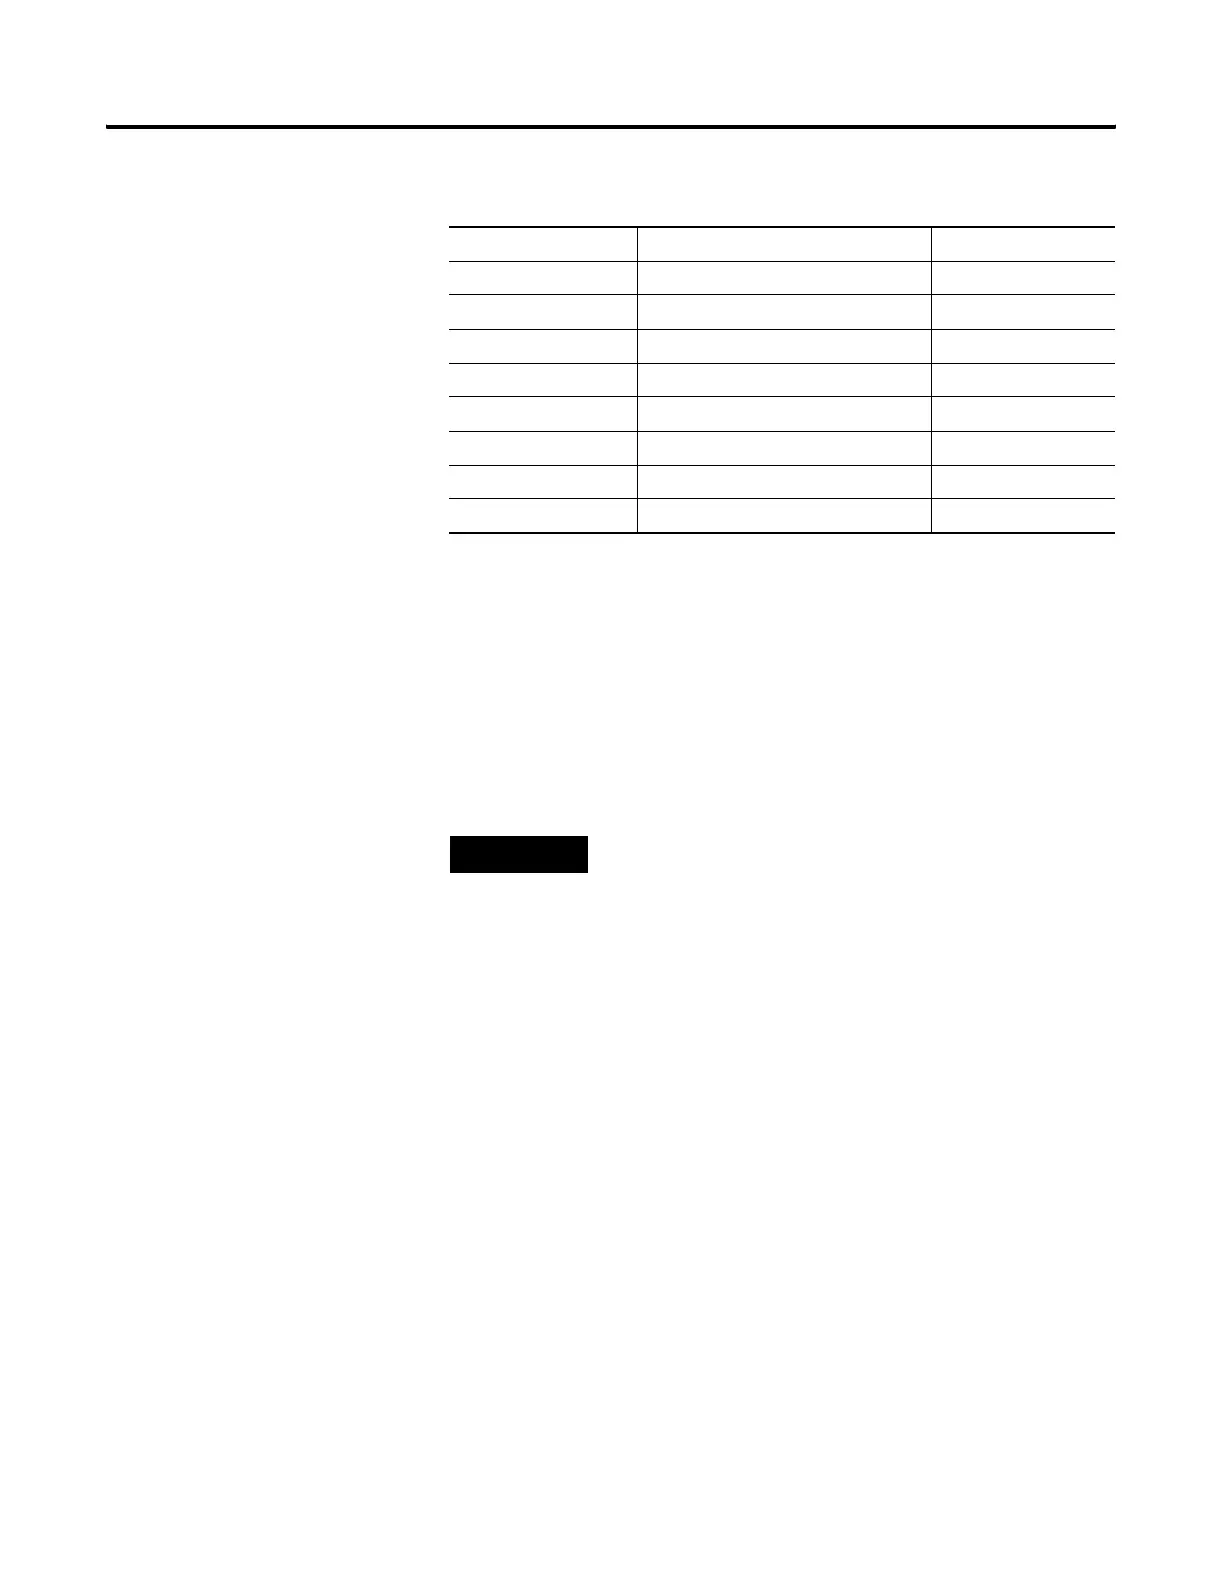
Thermocouple Type Thermocouple Reference Point Error
J +275°C (+527°F) ±3.0°C (±5.4°F)
K +550°C (+1022°F) ±3.0°C (±5.4°F)
T +65°C (+149°F) ±3.4°C (±6.12°F)
E +365°C (+689°F) ±2.5°C (±4.5°F)
R +885°C (+1625°F) ±6.5°C (±11.7°F)
S +885°C (+1625°F) ±7.2°C (±12.96°F)
B +1060°C (+1940°F) ±8.4°C (±15.12°F)
N +500°C (+932°F) ±3.0°C (±5.4°F)
TIP
The data was recorded at 60 Hz. Values at 10 Hz and
50 Hz would be comparable.
 Loading...