Version 1.2 ©Copyright 2020, Ambient LLC. All Rights Reserved. Page 27
Figure 25 defines the conditions for rising and falling pressure every 3 hours.
Humidity Change per 3 Hours
Temperature Change per 3 Hours
Figure 25
6.15 Wireless Signal Strength Indicator
The wireless signal strength displays reception quality. If no signal is lost, the signal strength indicator will display 5
bars. If the signal is lost once, four bars will be displayed, a shown in Figure 26.
Figure 26
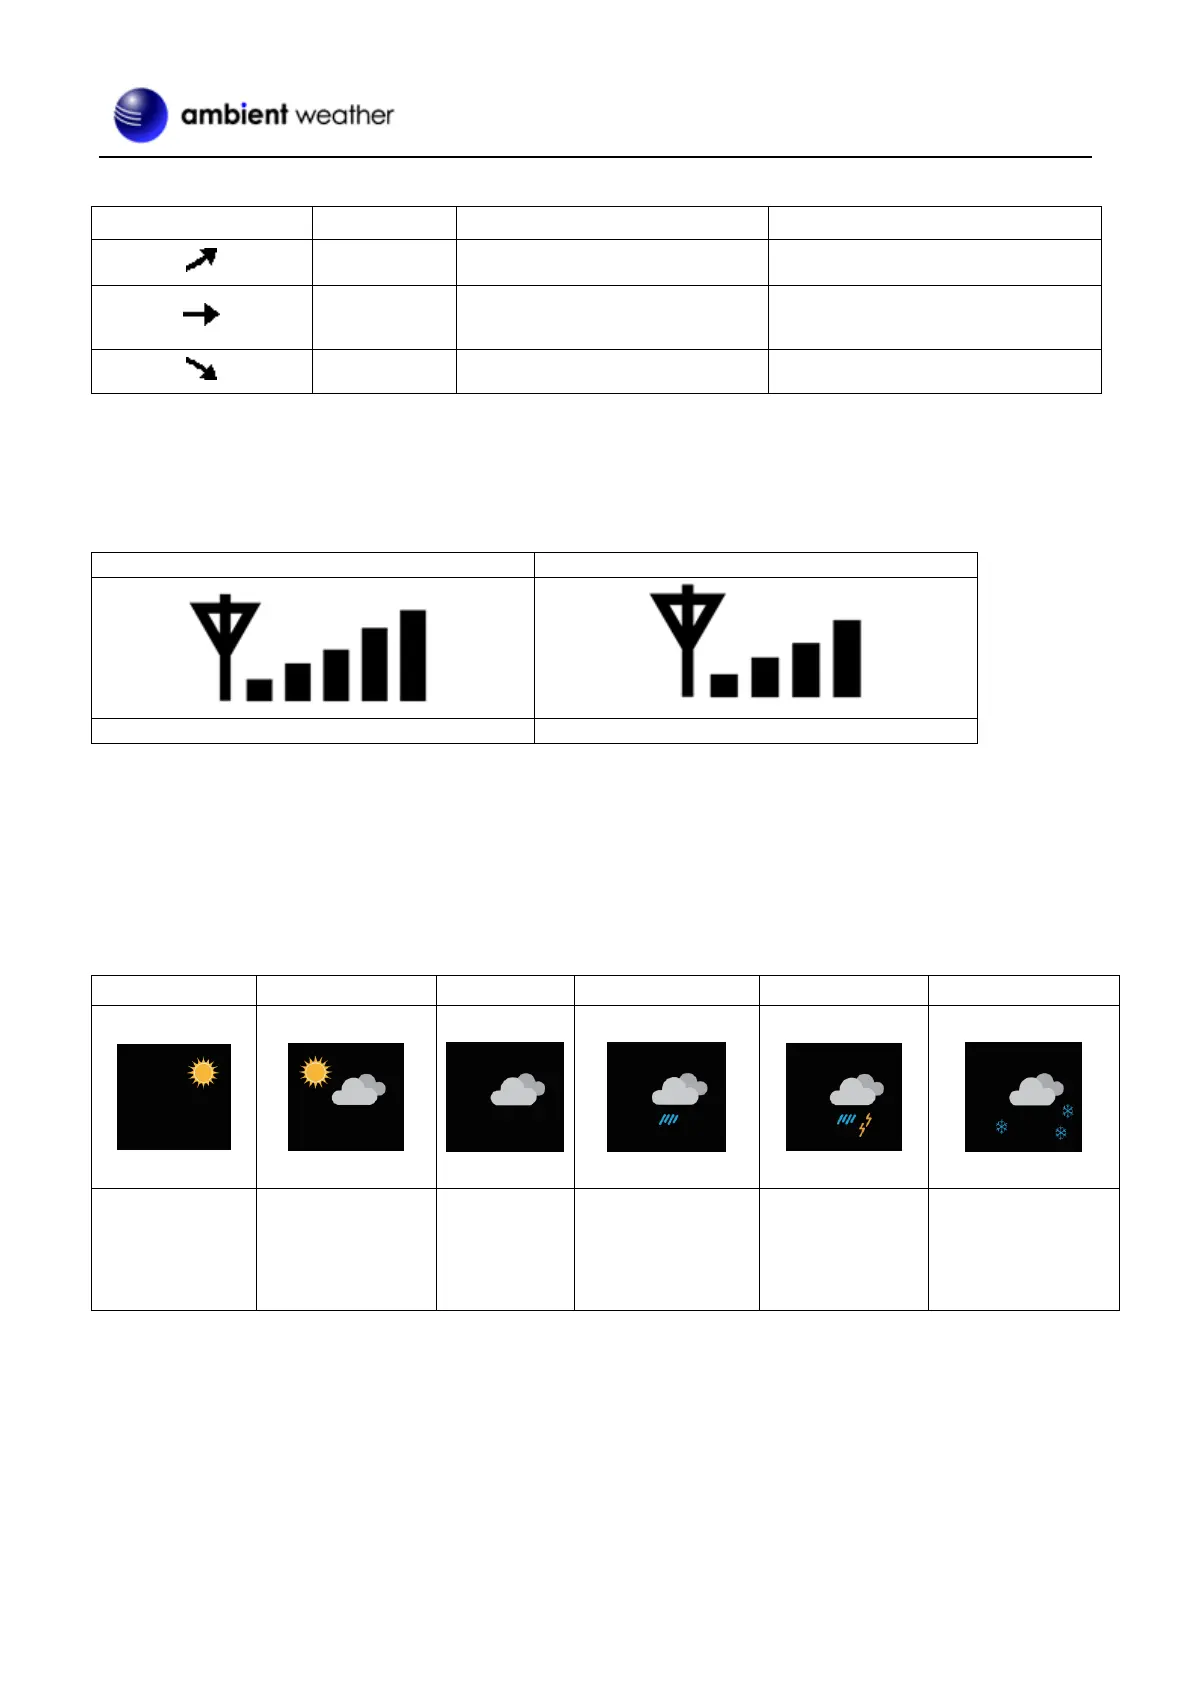
6.16 Weather Forecasting
The five weather icons are Sunny, Partly Cloudy, Cloudy, Rainy, Stormy and Snowy.
The forecast icon is based on the rate of change of barometric pressure. Please allow at least one month for the weather
station to learn the barometric pressure over time.
Pressure increses
for a sustained
period of time
Pressure increases
slightly, or initial
power up
Pressure
decreases
slightly
Pressure decreases
for a sustained
period of time
Pressure rapidly
decreases
Pressure decreases
for a sustained
period of time and
temperature is
below freezing
Figure 27
6.16.1 Storm Alert
If there is a rapid drop in barometric pressure, the forecast icon will flash.
6.16.2 Weather Forecasting Description and Limitations
In general, if the rate of change of pressure increases, the weather is generally improving (sunny to partly cloudy). If
the rate of change of pressure decreases, the weather is generally degrading (cloudy, rainy or stormy). If the rate of
change is relatively steady, it will read partly cloudy.
 Loading...