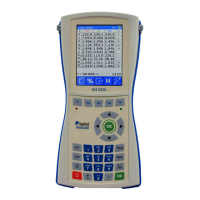
5.14 Vector Diagram
Vector diagram can be activated by key DEL. In this diagram are showed all voltages and currents
(minimal amplitudes are 0.5V, 0.5mA).
Diagram represents graphic interpretation of harmonic content. There is a chart on the left and by up
and down arrows zooming is changed in range 1x - 20x. On the right side there is a list of harmonic
items where the 1
st
column from left (Harm) means the number of harmonic item, 2
nd
column (U[%])
states for harmonic item’s amplitude in % related to the fundamental harmonic and the 3
rd
column (ph[°])
states for phase shift of harmonic item.
Paging of this list is possible via left and right arrows on the keypad. Repeated pressing of DEL button
rotates the currently displayed channel. There are 6 available channels:
L1 VOLTAGE, L1 CURRENT ... L3 CURRENT.
5.15 Meter Error Test and Meter Constant Test
Meter error can be measured in OPS Measurement Mode. This mode is used to control Local
Evaluation Unit OPS and measure error of connected electricity meter. This mode can be selected
using menu item Measurement / Energy / Impulse / OPS Meas/Test -> or by pressing "EXP" key from
the basic mode if device has installed appropriate hardware (hardware versions 1.08 and more). Mode
can be closed by pressing "ESC" or "EXP" buttons.
The basic activities of the device are not suspended – device is measuring in background.
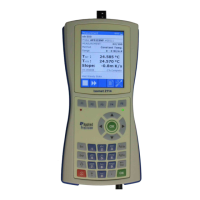
OPS Measurement Mode window – Meter Error Test
Description of OPS Measurement Mode window:
Left part of window
1
st
- 3
rd
Line:
- measured values .... measured values of (active, reactive or apparent) power, voltage and
current in all channels.
4
th
- 5
th
Line:
- mode indicator ....... mode indicator shown in the beginning of 5
th
line: “e” indicates meter error
test and “k” indicates meter constant test.
- impulse counter ..... counter of impulses captured from tested meter shown in the beginning of
4
th
line. This number has initial value equal to value of right part parameter
“Imp.” and is lowered by 1 after every received impulse. When it reaches
zero then new measured sample is calculated.
- sample counter ...... counter of samples shown in the beginning of 5
th
line after mode indicator.
Counter shows progress: number of measured samples / required number
of samples set in right part parameter “Samp.”.
- error / state ............. measured meter error or actual state (mode) of local evaluation unit OPS
is shown with large letters in both lines
P: 95.37 , 95.42 , 95.21 |<1>Meas ON
U: 230.3 , 230.6 , 229.8 |<2>Calib OFF
I: 414.1m, 413.8m, 414.3m |<3>Input LED
3 |<4>Res. HIGH
e:06/10 |<5>Wind. 10%
k:10000 ▲02:-0.012% |<6>Imp. 5
AVG:-0.013% 03:-0.015% |<7>Samp. 10
STD:+1.23E-02 ▼04:-0.014% |<8>Mode<9>Clr