ASPION G-Log Manager – PC software / Data analysis
User manual – Version 3.2/11-19 Copyright © ASPION GmbH Page 32
10. Data analysis
By going to Data analysis in the left area, you receive all information of a read-out sensor. Since the setting
options between ASPION G-Log (incl. Waterproof) and ASPION G-Log 2 are different for only the recording
of temperature and climate events, they are described in separate chapters (10.5 Temperature for ASPION
G-Log and 10.6 Climate for ASPION G-Log 2). The evaluation of shock events, shock details and orientation
are identical.
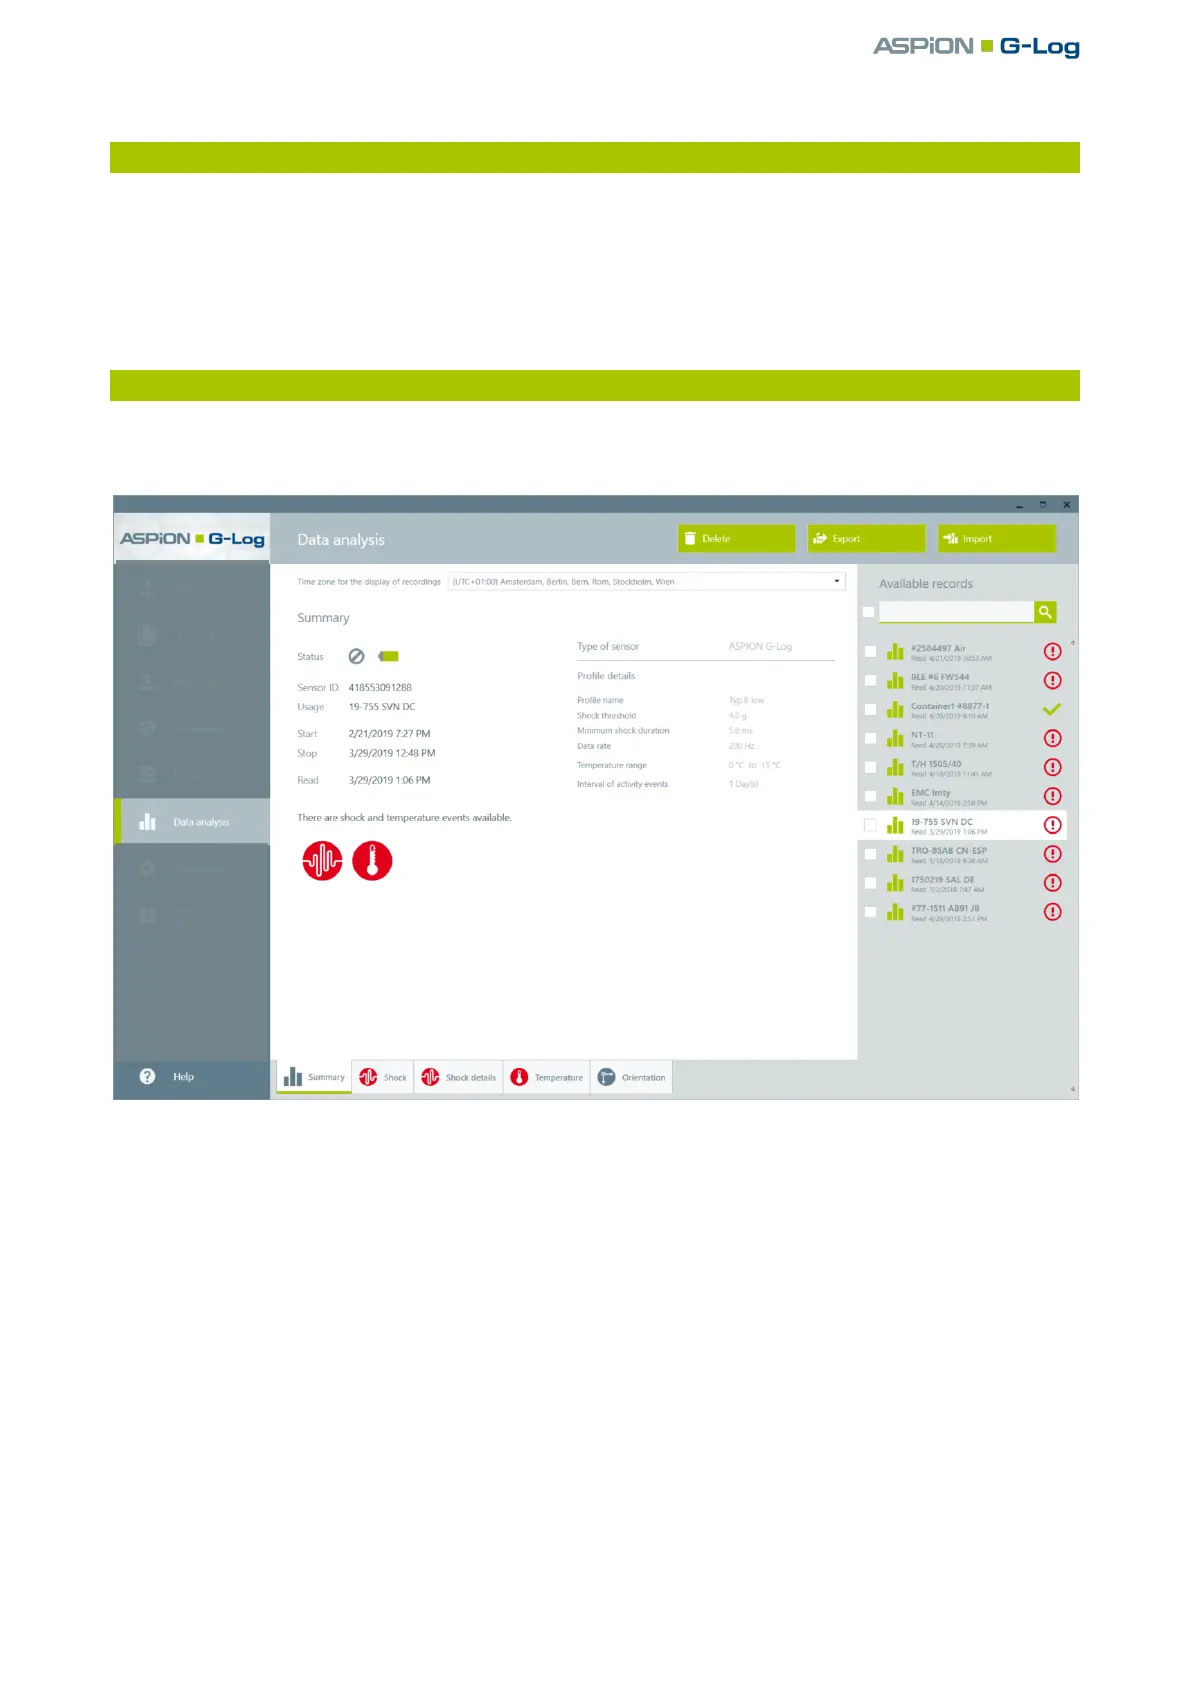
10.1 Content, overview and functions
Select Data analysis in the left area. The program automatically selects the first entry from the list view
on the right.
A data analysis includes the following information:
Select the time zone in which you want to display the sensor information and recordings. The time
zones also include summer and winter times. The time zone bar remains unchanged for all analyses
views.
Selecting the tab: Depending on the selected tab in the lower bar, the content area (see ) displays
the corresponding information. Use the tabs to select which events you want to display. If you cannot
select a tab, no events are recorded.
The Summary tab shows all sensor details, the shipment, the current status and profile details in the
content area. This tab is automatically selected each time an analysis is retrieved.
You delete the currently active analysis with the Delete button.