ASPION G-Log Manager – PC software / Data analysis
User manual – Version 3.2/11-19 Copyright © ASPION GmbH Page 37
The content area includes the following information:
The activity events visualize the approximate orientation towards the 6 main directions. If the
orientation changes, it will be displayed the next time an activity event is recorded.
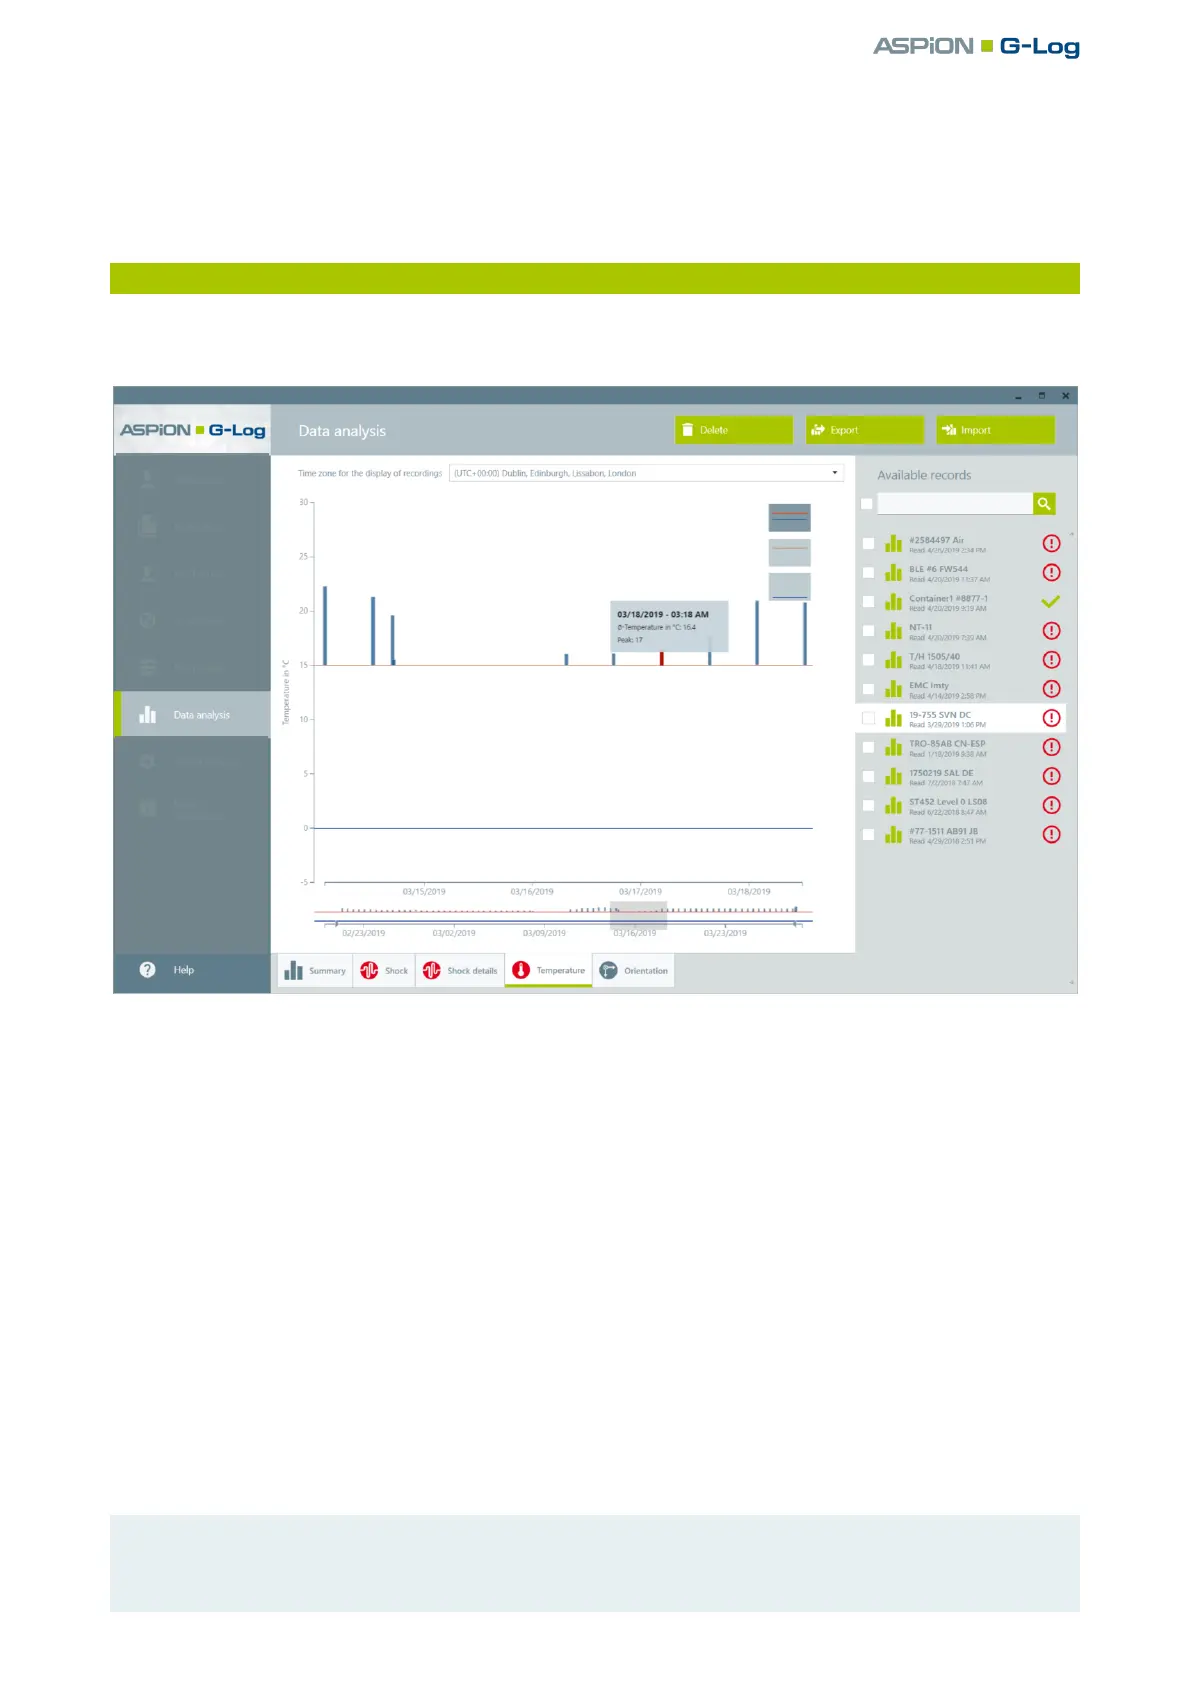
10.5 Temperature events with ASPION G-Log
Select the Data analysis function in the left area. Select the desired analysis from the list area to the
right. Click on the Temperature tab.
The content area includes the following information:
Display area of temperature events represented by a blue bar. The permitted temperature range is
marked by a red and blue line.
Scheme of recording temperature events:
The temperature is measured every 5 minutes with the internal and factory-calibrated temperature
sensor and recorded as follows:
Case 1: If the temperature remains within the prohibited range for at least 10 minutes and then returns
to the permitted range, a temperature event is created.
Case 2: If the temperature remains permanently outside the permitted range, a temperature event is
stored approx. every 10 hours at the end of the recording.
Please also refer to ASPION G-Log Manager – PC software, chapter 6.1, "Profile settings for ASPION G-
Log".
Using the mouse-over function, you receive the details of a single temperature event. For each
temperature event, the average temperature and one peak value are recorded.
Please note: In the case of temperature events that are recorded shortly after each other - due to a
varying value around the set threshold value - the bars can be close together. For further details, use
the zoom function (see) or the export functions (see previous chapter 10.1).