ASPION G-Log Manager – PC software / Data analysis
User manual – Version 3.2/11-19 Copyright © ASPION GmbH Page 36
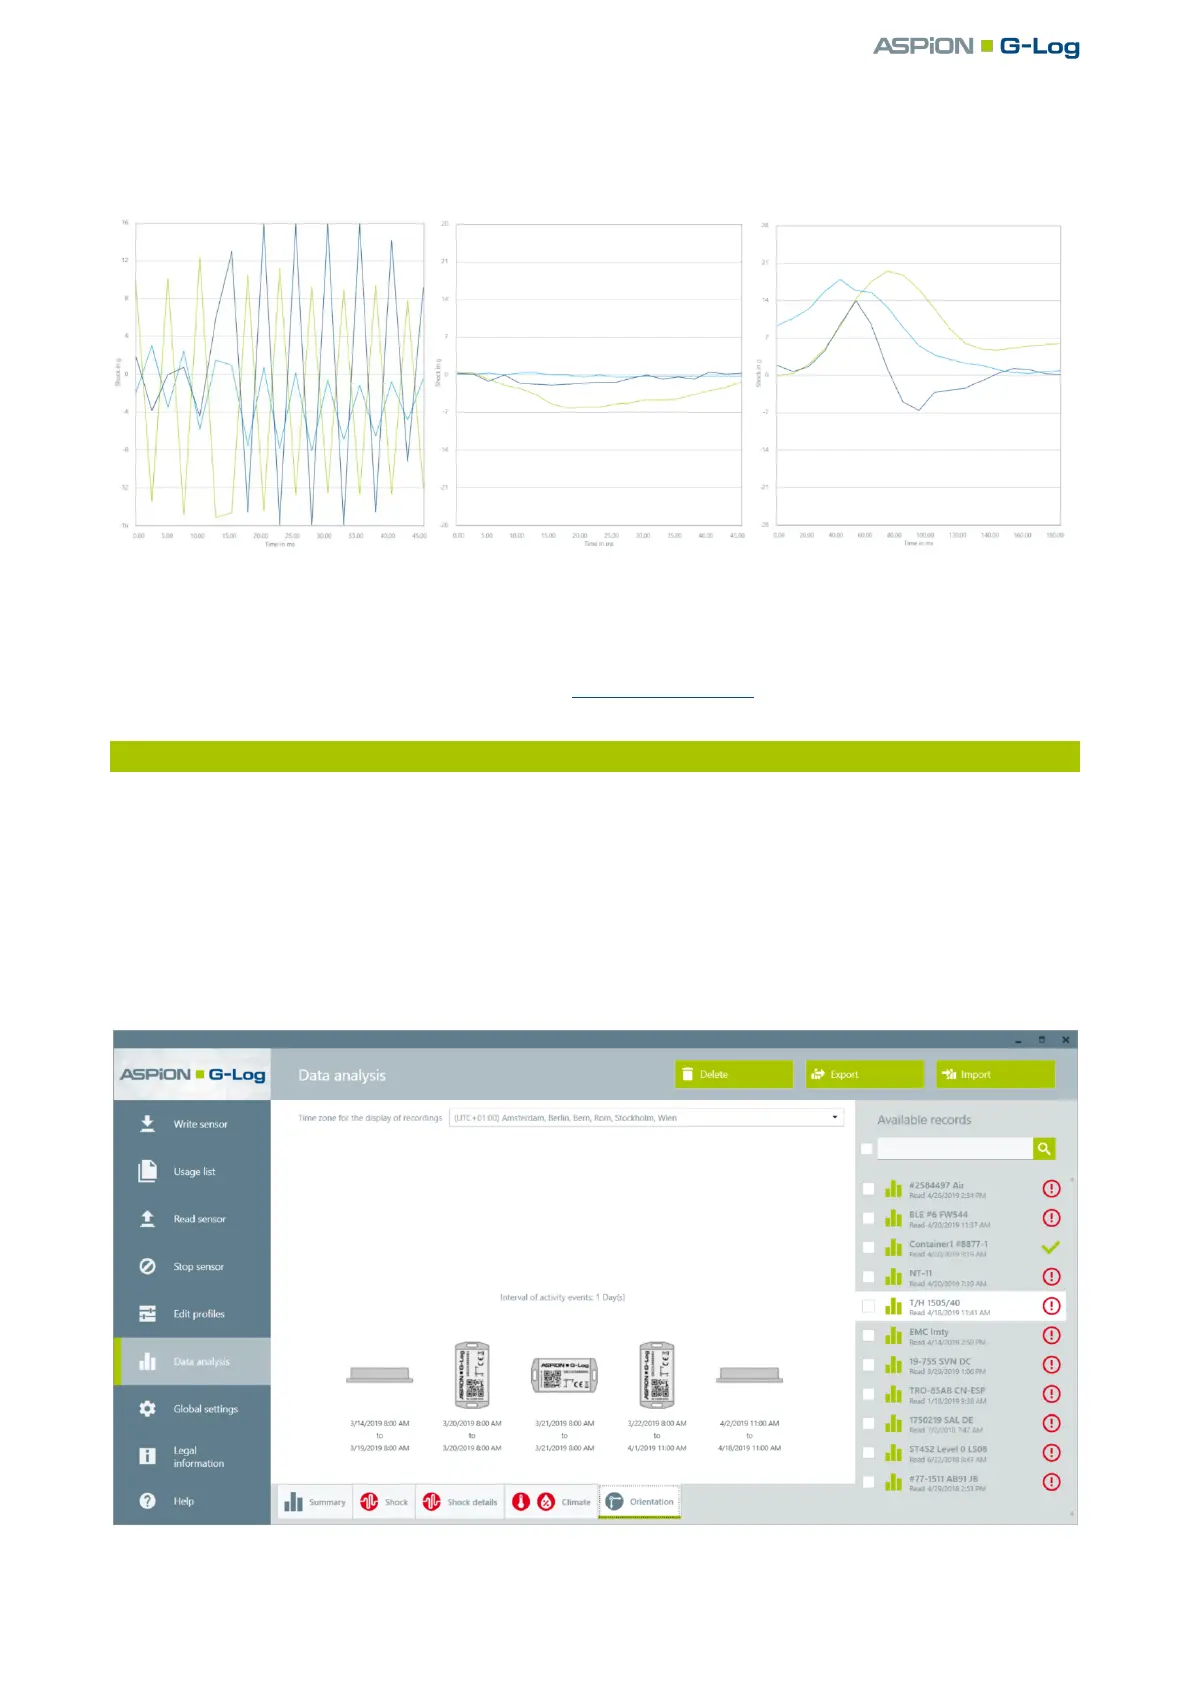
The following recordings of shock details and their interpretation support you to better classify your own
curves of shock details.
Vibration curves: Typical curve Curve display for
Short pulses of short duration for air freight longer shocks, eventually critical
We will be happy to help you with the interpretation of your evaluations at any time: Simply contact our
support team, which can be contacted by e-mail at support@aspion.de.
10.4 Orientation
Whether the orientation of the sensor – and thus that of your transported goods – has changed
permanently can be seen from the simple orientation visualization: the sensor records the current values of
the acceleration sensor according to the set interval for the activity events. From these data, the main
direction of gravity of approx. 1 g is determined. This determines the orientation of the sensor at this point
in time.
Select the Data analysis function in the left area. Select the desired analysis from the list area to the
right. Click on the Orientation tab.
 Loading...