ASPION G-Log Manager – PC software / Data analysis
User manual – Version 3.2/11-19 Copyright © ASPION GmbH Page 34
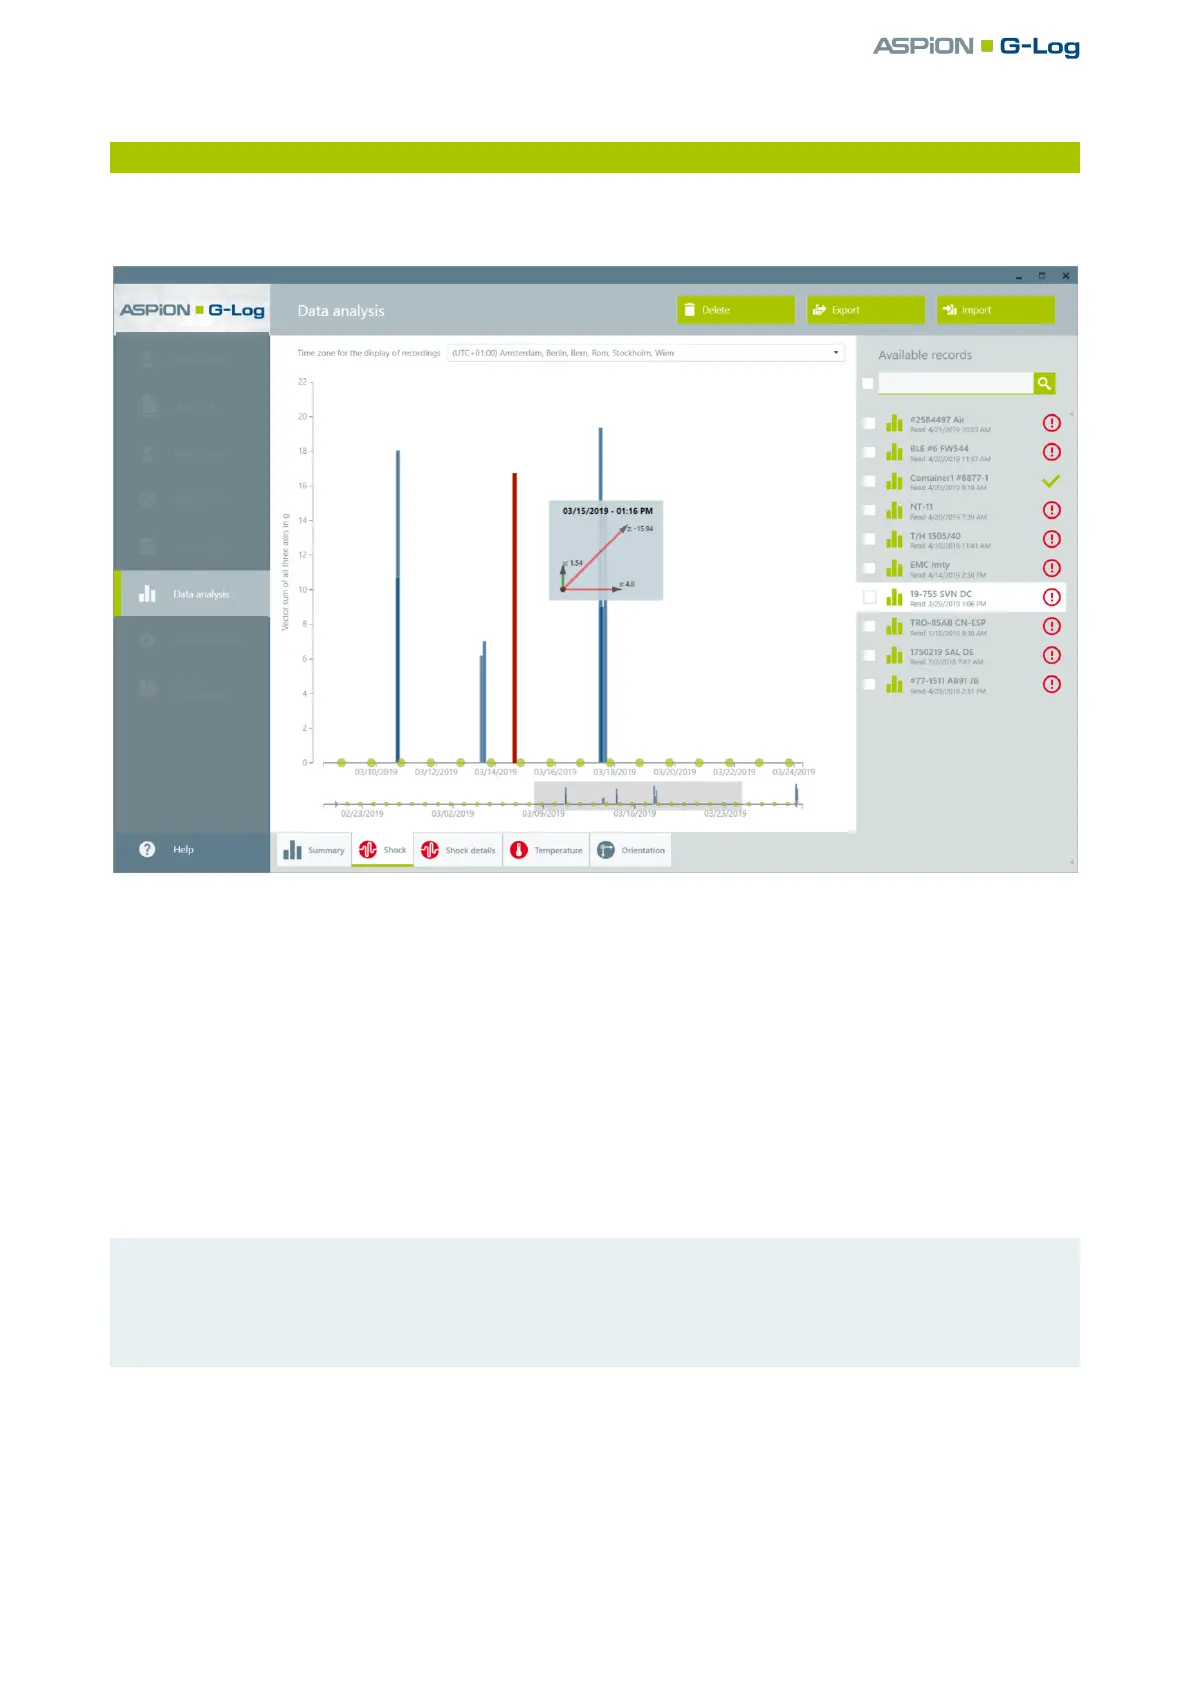
10.2 Shock events
Select the Data analysis function in the left area. Select the desired analysis from the list area to the
right. Click on the Stop sensor tab.
The content area includes the following information:
Display range of shock events represented by a blue bar. The height of a single shock event displayed as
bar chart is calculated from the amount of the vector sum of all axes.
Display area of the activity events on the timeline to be able to check if the sensor is active and for
orientation visualization, represented by a green circle.
Using the mouse-over function, you receive the details of a single shock event or activity event. The
arrows of the axis displayed in red show an overlap of the threshold in the respective axe direction. The
maximum values can vary depending on the measuring range you have defined (± 16 g or ± 24 g), see
ASPION G-Log shock sensor, chapter 7, "Global settings".
Please note: if shock events are recorded at the same second, the bars may overlap. They may then
partly not be displayed in red when using the mouse-over function. The bar with the lowest cumulative
value is displayed at the front, followed by higher bars in the back. To retrieve more details, use the
zoom function (see ) or the export functions (see previous chapter 10.1).
Zoom function: if you want to have more details of a certain time period, select a time period with a
pressed-down left mouse key. This period will then be displayed in the upper content area. By double-
clicking the left mouse button in this area, you go back to the general overview. The gray shading marks
the selected time period. The start time of the recording is marked by a gray triangle, the end (Stop) of
the recording – if available – is marked accordingly at the end of the timeline.
 Loading...