33
See 5.3. Functions of the "Groups"
Tab for more information.
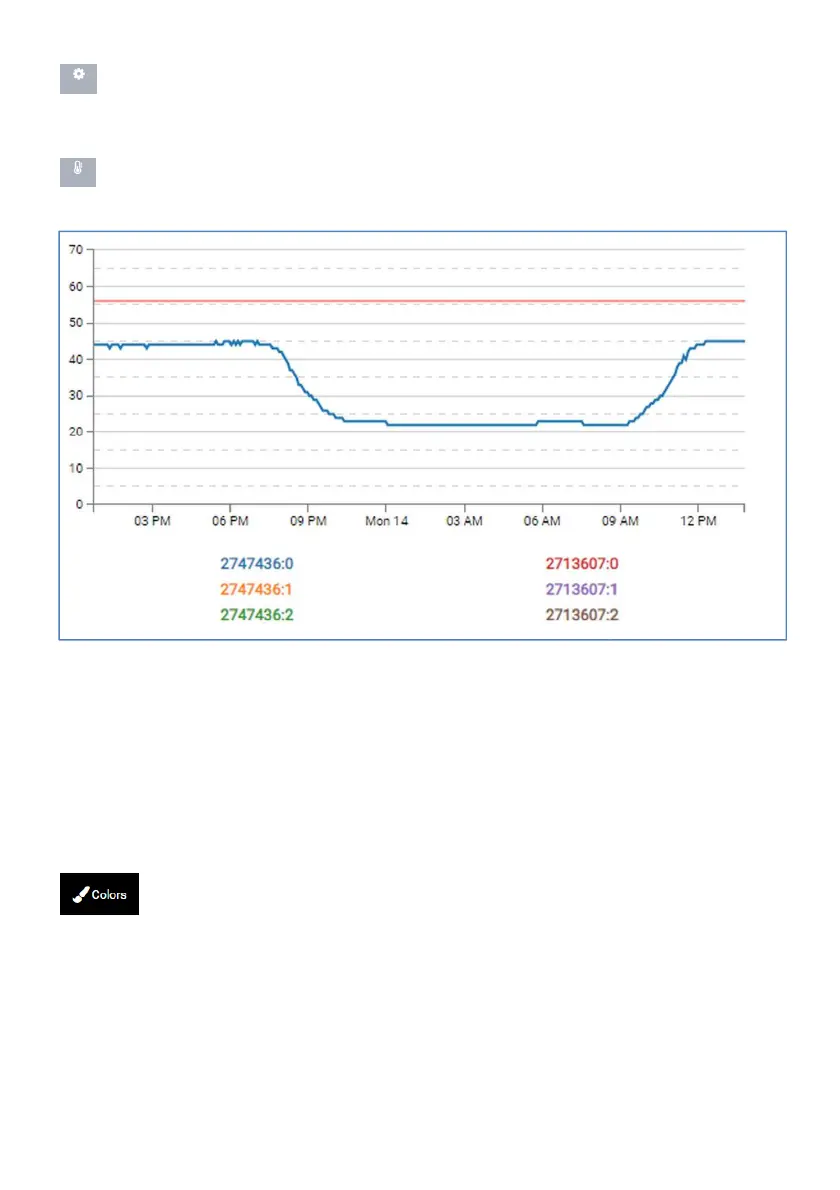
A click on the temperature sy
mbol opens the graphic diagram of the temperature
history of the sections of the last 48 hours.
The graphs of the individual sections can be hidden or displayed by clicking on the se
tion number.
If the temperature exceeds 56°C (red line), the
temperature management takes effect
and reduces the intensity of the respective section.
5.2. Functions of the "Colors" Tab
A click on "Colors" opens the window in which you can edit the colors of the
LED sections, activate the preview function and speci
tion of the programmed color in the diagram.
Tab for more information.
mbol opens the graphic diagram of the temperature
The graphs of the individual sections can be hidden or displayed by clicking on the se
c-
temperature management takes effect
A click on "Colors" opens the window in which you can edit the colors of the
a-