microLAN b.v. BACTcontrol – Software Manual – V1.15 Page 15 of 28
6.5 VIEWER
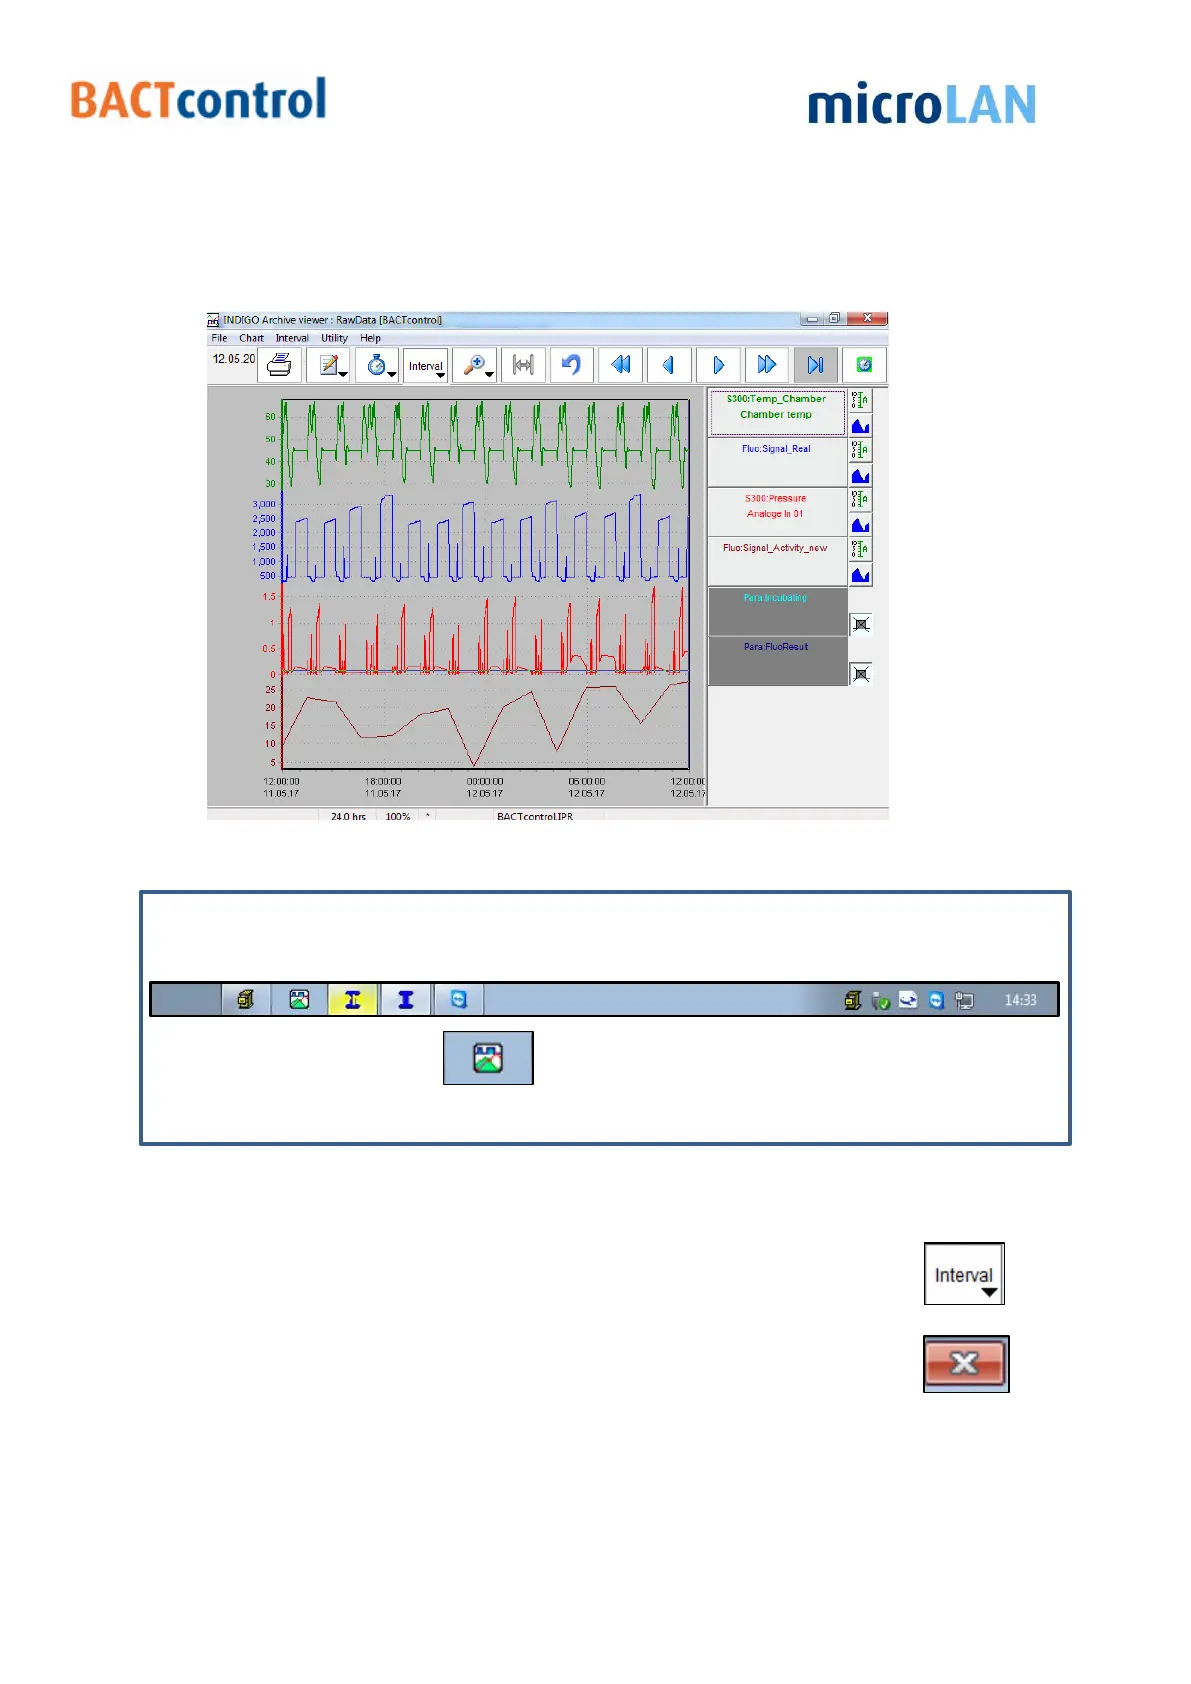
A graph of the measurements results can be displayed in the Viewer menu.
(used program: INDIGO Archive viewer).
Figure 10 Graph data BACTcontrol
When there is no graph displayed after clicking on the Viewer button:
Go to the status bar on the bottom of the screen
(only visible when pointed on it)
Press the graph button
Now a graph appears.
Move the cursor along the graph and click to see the results of a specific time on the
right side of the window.
A specific time frame vary from 1 hour to 1 month can be selected with
Close the graph (and the program INDIGO Archive viewer) by clicking on