9 | Diagnostic data Baumer
44 Operating Manual OM20/ OM30 RS485 with Modbus RTU | V1
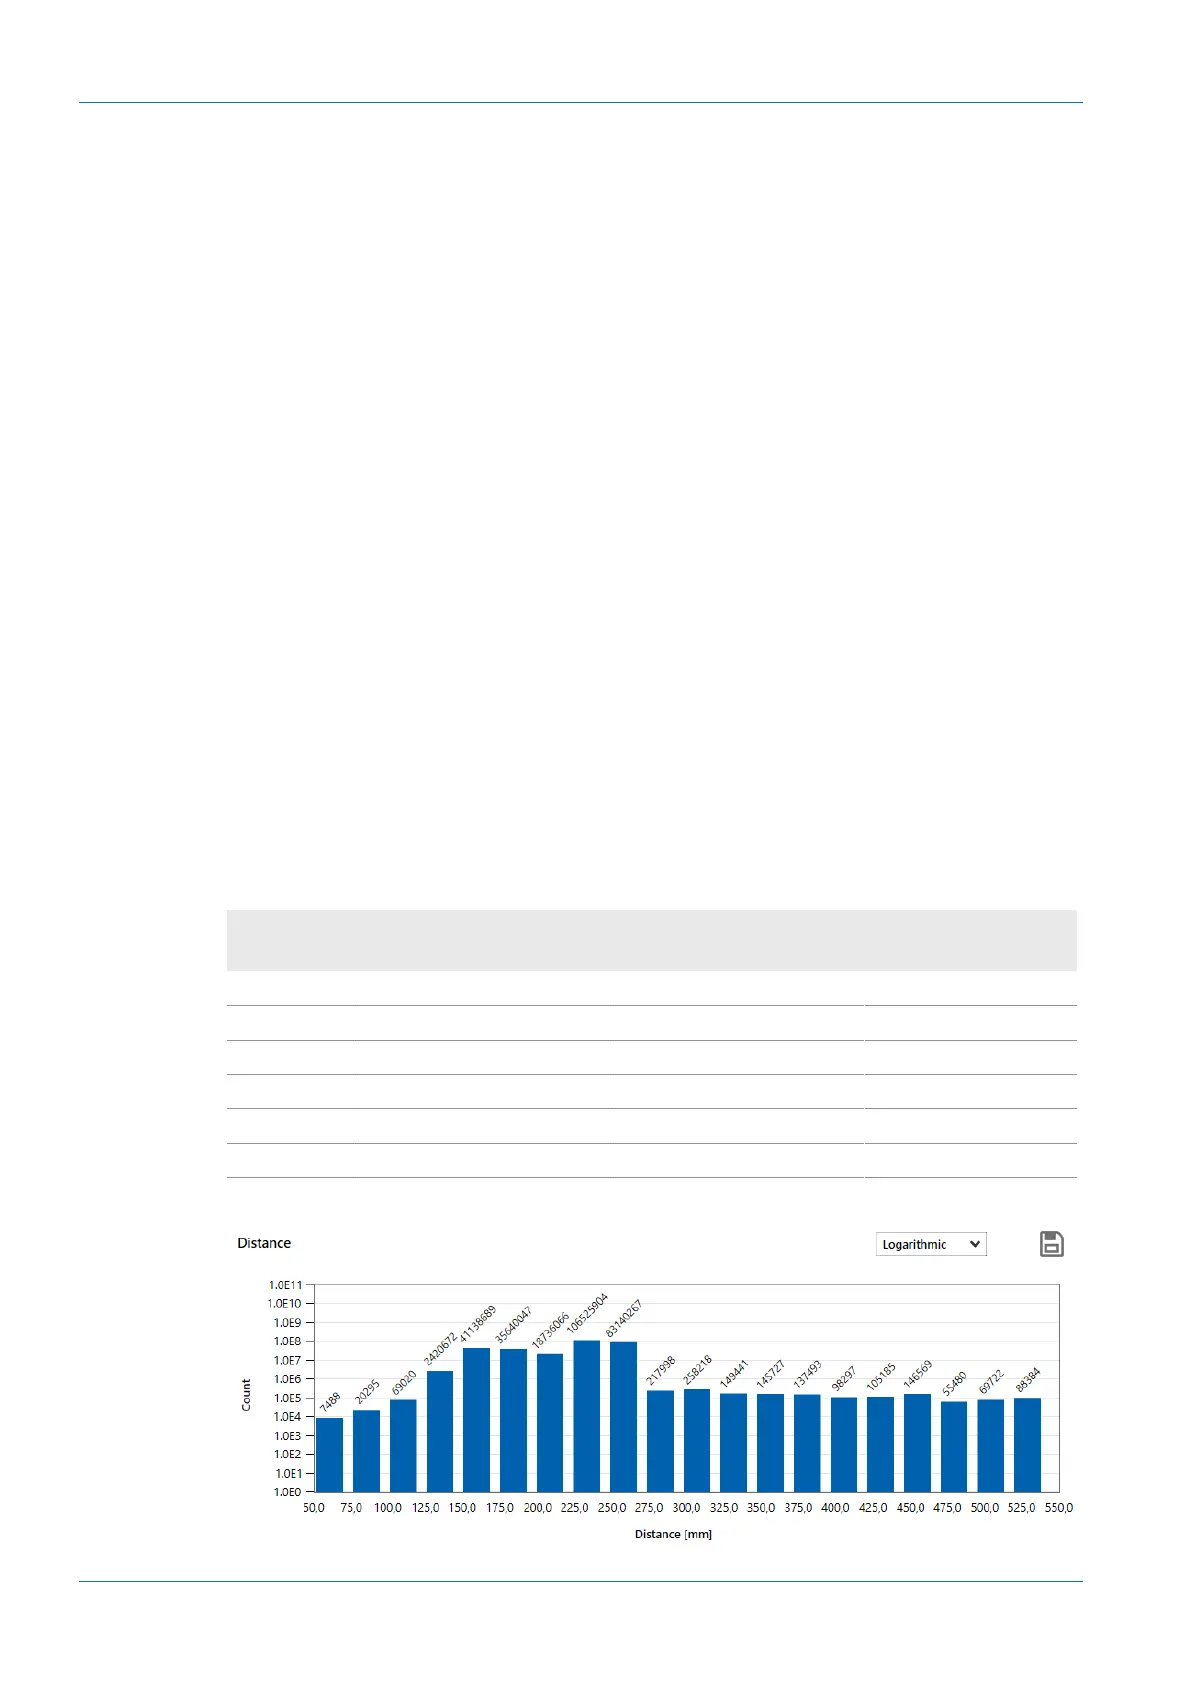
9.2 Histogram function
The histogram function counts the appearance of values within defined intervals (bins). The
number of values refers to the followings key data:
n
Distance
n
Exposure reserve
Distance
With each cycle, a measured value (distance) is recorded. The following information is avail-
able:
n
Unit
n
Start of valid range
n
End of valid range
n
Number of intervals/bins
Example:
Measurement range of the sensor: 50-550mm:
n
Unit: mm
n
Start of valid range: 50mm
n
End of valid range: 550mm
n
Number of intervals/bins: 20
This yields:
Interval/bin covers the following range: (550mm - 50mm)/20 = 25mm
If the sensor records the value 76mm 5 times and the value 162mm 15 times in 20 measure-
ments, the following distribution results:
Bin Value range min. Value range max.
Number of
measurements
Bin 1 50 mm < 75 mm 0
Bin 2 75 mm < 100 mm 5
Bin 3 100 mm < 125 mm 0
Bin 4 125 mm < 150 mm 0
Bin 5 150 mm < 175 mm 15
... ... ... ...
Example of a recorded distance histogram: