3. Select the square wave output and adjust
the frequency to several check points
within the passband of the device under
test, such as 20 Hz, 1 kHz, and 10 kHz.
4. At each frequency checkpoint the wave-
form obtained at the output of the device
under test provides information regarding
its performance with respect to the fre-
quency of the square wave input. Fig. 13b
indicates the possible waveforms
obtained and the interpretation of their
characteristics.
Square wave evaluation is not practical
for narrow-band amplifiers. The restricted
bandwidth of the amplifier cannot reproduce
all frequency components of the square wave
in the proper phase and amplitude relation-
ships.
TESTING SPEAKERS AND
IMPEDANCE NETWORKS
A function generator can be used to pro-
vide information regarding the input imped-
ance of a speaker or any other impedance net-
work vs. frequency. In addition, the resonant
frequency of the network can be determined.
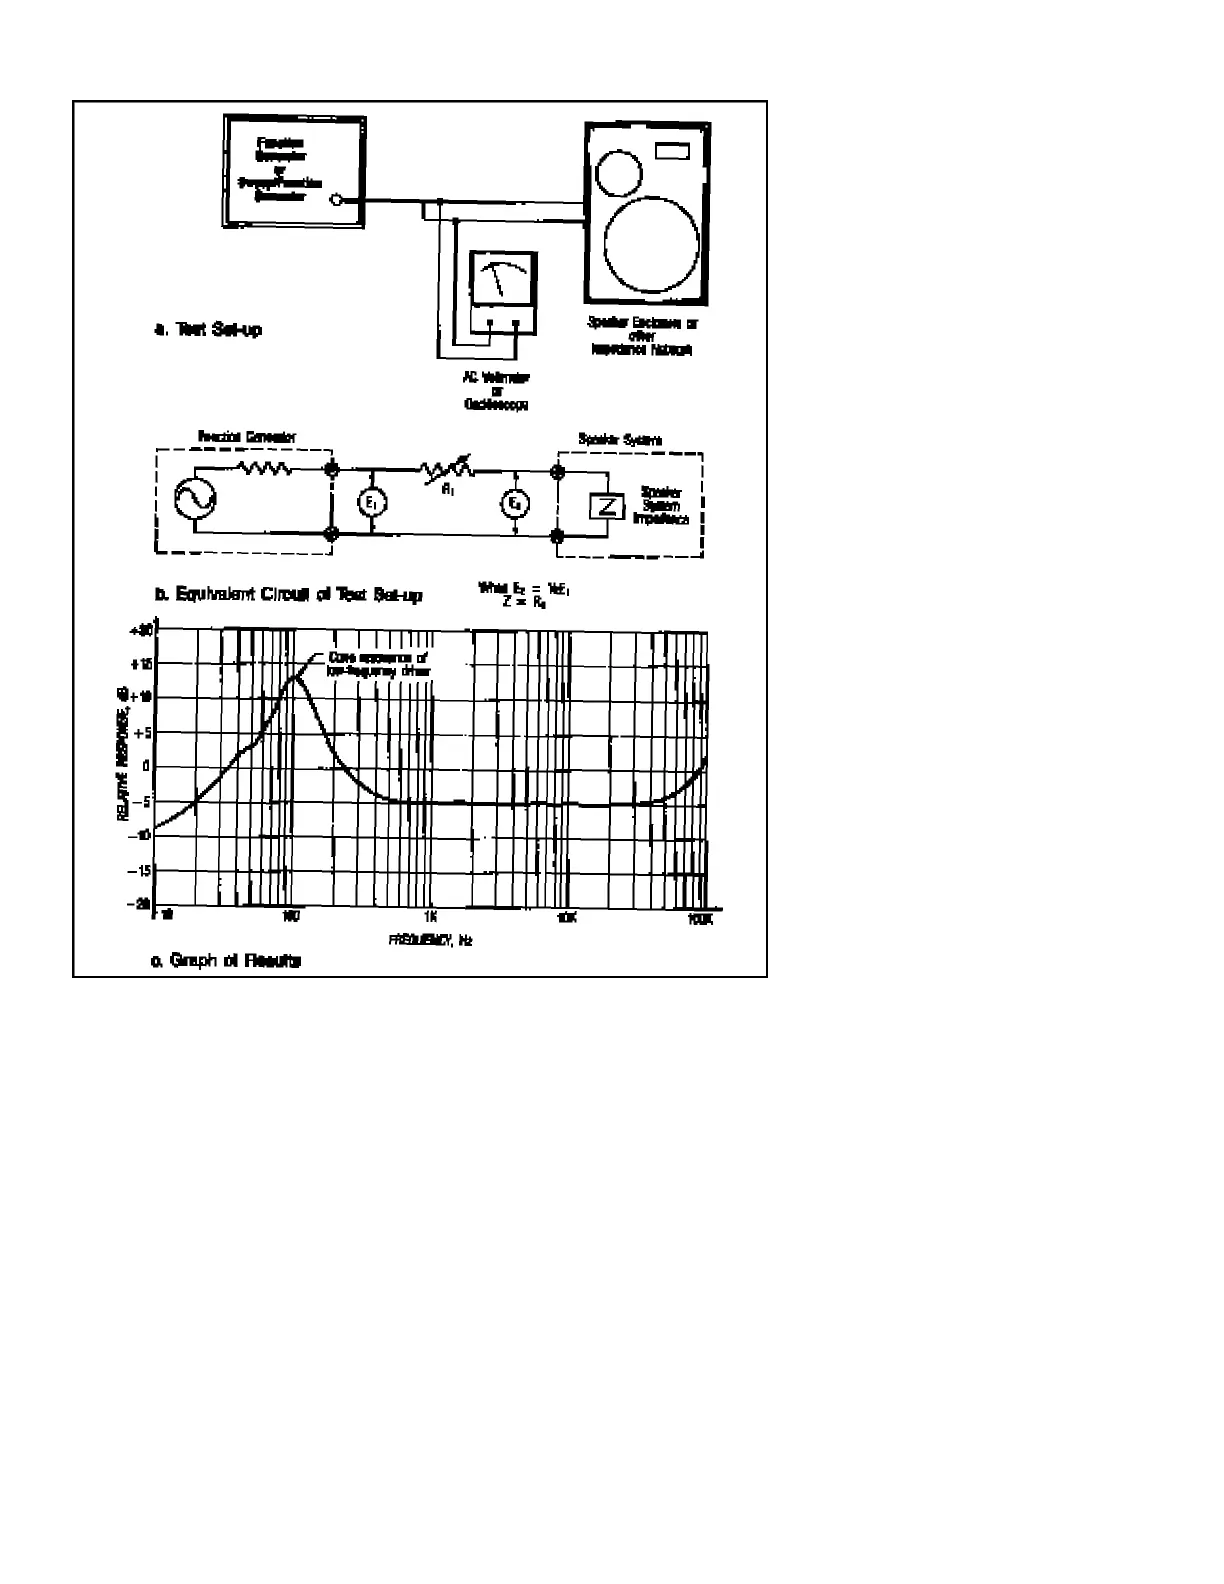
1. Connect equipment as shown in Fig. 14a.
The oscilloscope may be used to verify
that the function generator is not in a clip-
ping condition.
2. If the voltmeter method is used, vary the
generator frequency over the full range of
interest and log the voltage measured at
the speaker terminals vs. frequency. The
dB scales of an AC voltmeter are conve-
nient for converting this information to
standard response units.
3. If the oscilloscope method is used, use
sweep operation for frequency response
measurement.
4. In speaker testing, a pronounced increase
of voltage will occur at some low fre-
quency. This is the resonant frequency of
the speaker system (Fig. 14c). The speak-
er enclosure will modify the results
obtained from the same speaker without
an enclosure. A properly designed enclo-
sure will produce a small peak on each
side of the peak obtained without an
enclosure. The enclosure designer can
use the response characteristics to evalu-
ate the effects of varying port sizes,
damping materials, and other basic enclo-
sure factors.
5. In testing other impedance networks, res-
onance will not necessarily occur at low
f r e q u e n c y. However, as resonance is
approached, the signal level will increase.
The impedance of the network can be
measured at resonance, or at other fre-
quencies if desired as follows:
a. Connect a non-inductive variable
resistor in series with the impede-
ance network as shown in Fig.
14b.
b. Measure the voltage at points E1
and E2 respectively and adjust
variable resistor R1 so that voltage
E2 equals one half of voltage E1.
c. The impedance of the network
equals the resistance of variable
resistor R1.
NOTES ON AMPLITUDE MODULAT I O N
Amplitude modulation, or AM, is the
varying of the amplitude of one signal in
accordance with the amplitude of another,
lower-frequency, signal. Many function gen-
erators allow the user to amplitude-modulate
the main output via either an external or inter-
nal modulation source. Refer to Fig. 15. The
top left waveform represents the unmodulat-
ed output of the generator. The two wave-
forms immediately below it show the output
carrier with 50% and 100% modulation,
respectively, where percentage is calculated
using the formula shown. The amount of
modulation is typically adjusted by a front
panel control which affects both the internal
and external source. The fourth waveform
shows the results of overmodulation (greater
than 100%), which is an undesirable condi-
tion.
The waveforms in the right column of
Fig. 15 represent a mode of AM known as
APPLICATIONS
Fig. 14. Testing speaker systems and impedance networks.
14