mark the location of the dot on the screen
for all frequencies of interest within the
sweep, as shown in the figure.
6. Turn on the sweep and adjust the sweep
width and starting controls for a trace
which encompasses all of the desired
markers on the screen. Adjust the sweep
rate control for a flicker-free display.
7. Connect the output of the generator to the
input of the circuit being tested. If neces-
sary, insert a termination for impedance
matching between the generator output
and the input of the device under test.
This is not needed if the input and output
impedances already match, e.g. both are
50Ω.
8. Connect the vertical (Y) input of the
oscilloscope to measure the voltage
across the output load of the circuit being
tested.
9. Select sine, triangle, or square wave as
appropriate. Sine wave signal is most
commonly used for frequency response
checks.
10. On most generators, linear and logarith-
mic sweep will both produce a linear dis-
play, because the GCV output voltage
becomes linear or logarithmic along with
the sweep. The log mode is nevertheless
sometimes preferred because it does not
sweep through the low frequencies as
rapidly.A method of obtaining a true log-
arithmic display is discussed in the next
section.
11. Set the amplitude of the generator output
and the vertical gain of the scope for con-
venient viewing height of the displayed
waveform. Be sure to keep the signal
below the clipping level of the circuit
being tested. To insure against clipping
start with a very low signal level and
increase signal amplitude until the high-
est peak on the display no longer increas-
es in height as the amplitude control is
increased. Then reduce amplitude slight-
ly below that point.
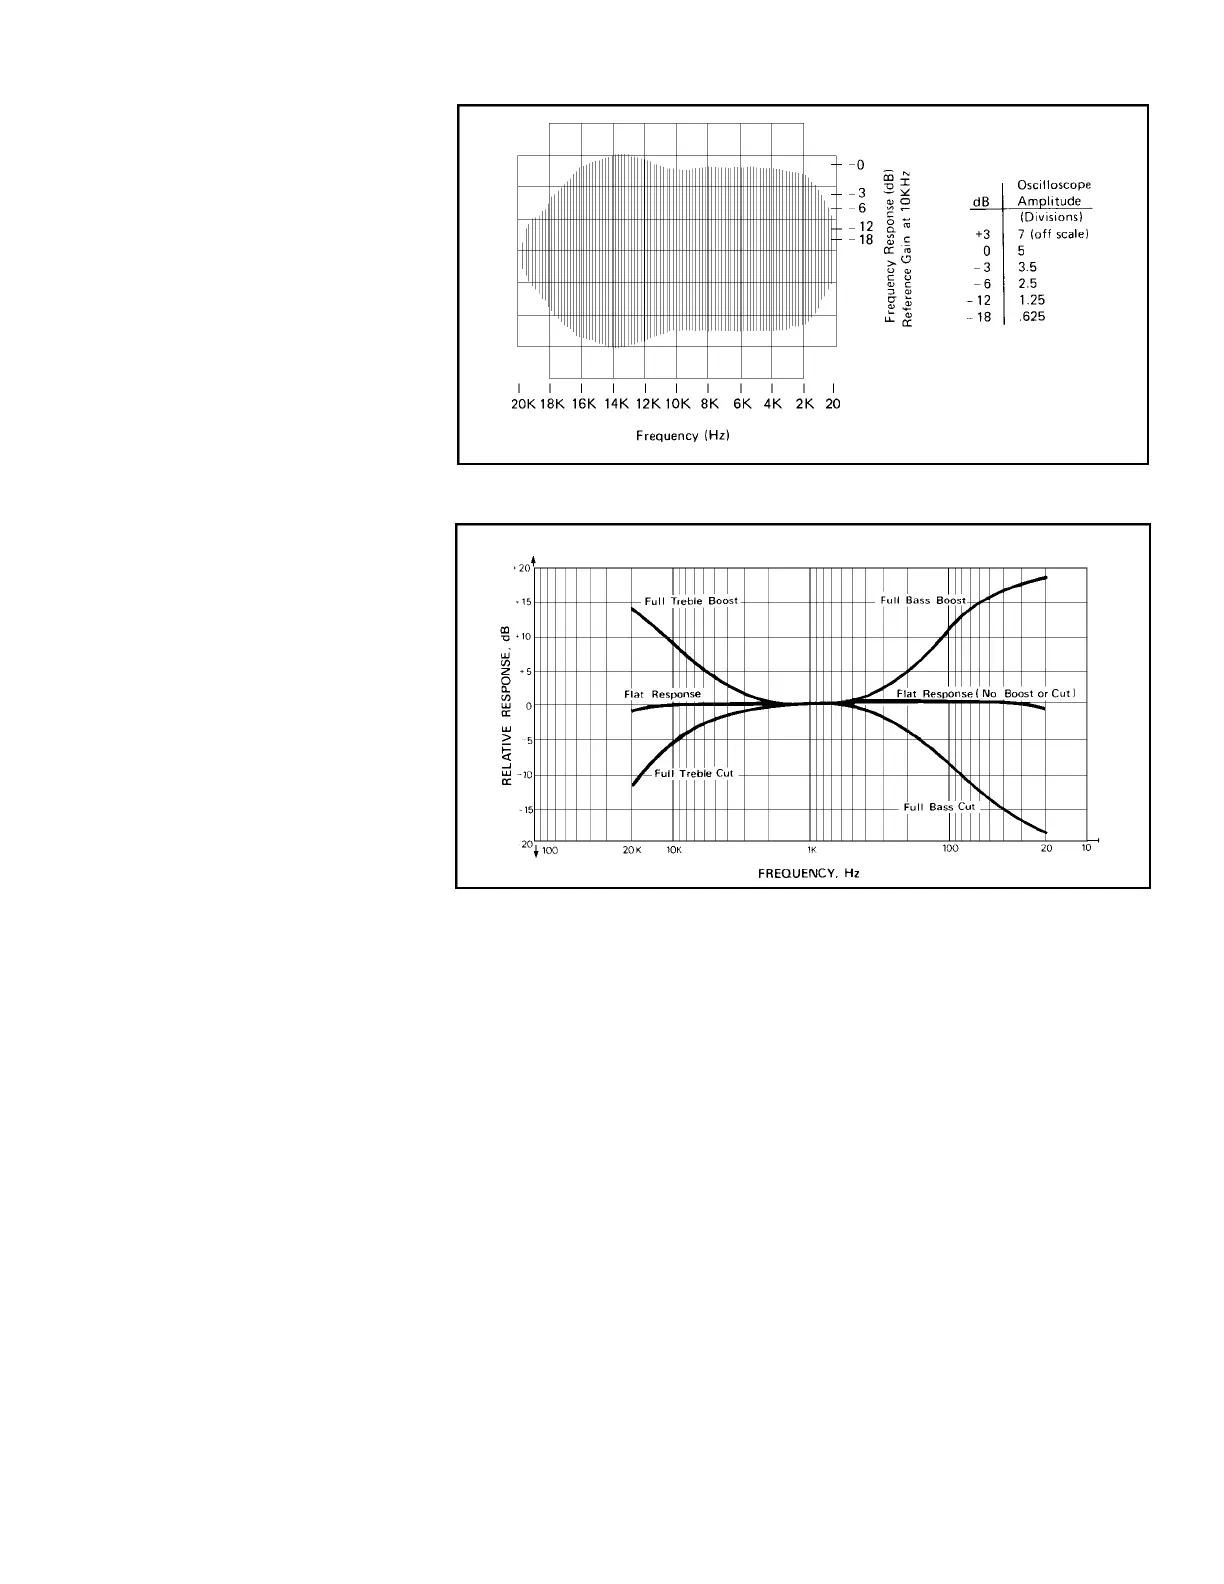
The Frequency Response Display
When using a conventional oscilloscope
probe, the display will be an envelope such as
shown in Fig. 10. The relative gain or attenu-
ation of all frequencies within the swept band
is displayed. The display may be analyzed for
acceptable or unacceptable frequency
response characteristics. In wideband ampli-
fiers, the objective is usually to maintain a
flat frequency response over the widest possi-
ble bandwidth. Frequency response displays
of filters and coupling networks show the cut-
off frequency and the sharpness of the cutoff.
The frequency response display is often the
basis for alignment of RF circuits (Figs. 16
and 17). The display also may be analyzed to
determine the center frequency of bandpass,
symmetry of bandpass, bandwidth, gain or
signal amplitude, Q, and rejection of adjacent
frequencies.
Tone Control Test
If an audio amplifier under test is
equipped with bass and treble controls, the
effects of these controls on overall response
can be determined by running frequency
response tests while adjusting the controls
throughout the range of adjustment. Fig. 11
illustrates some typical responses (note:
graph is logarithmic).
F R E Q U E N C Y RESPONSE MEASURE-
MENTS, LINEAR/LOG DISPLAY
Introduction
Most sweep generators are equipped with
logarithmic and linear sweep capability.
Logarithmic frequency response curves are
quite common on specification sheets for
amplifiers and other equipment. Whereas lin-
ear characteristics give more resolution of
high frequency response, log displays give a
more detailed picture of the low frequency
end. Sometimes it is desirable to use both
methods in examining frequency response
characteristics of a device.
A difficulty is encountered in trying to
generate a log characteristic using the GCV
output, as stated in the previous section.
Since this output is proportional to frequency,
it becomes linear or logarithmic along with
the sweep. Using it as a horizontal deflection
signal for a scope results in a display that is
always linear, whether the sweep itself is lin-
ear or logarithmic.
APPLICATIONS
FIG. 11. Effects on audio frequency response by varying tone controls.
11
FIG. 10. Typical audio amplifier response display.