DISPLAY RESULTS
After successful measurement and processing of the subject data, the results
are displayed as selected by the operator.
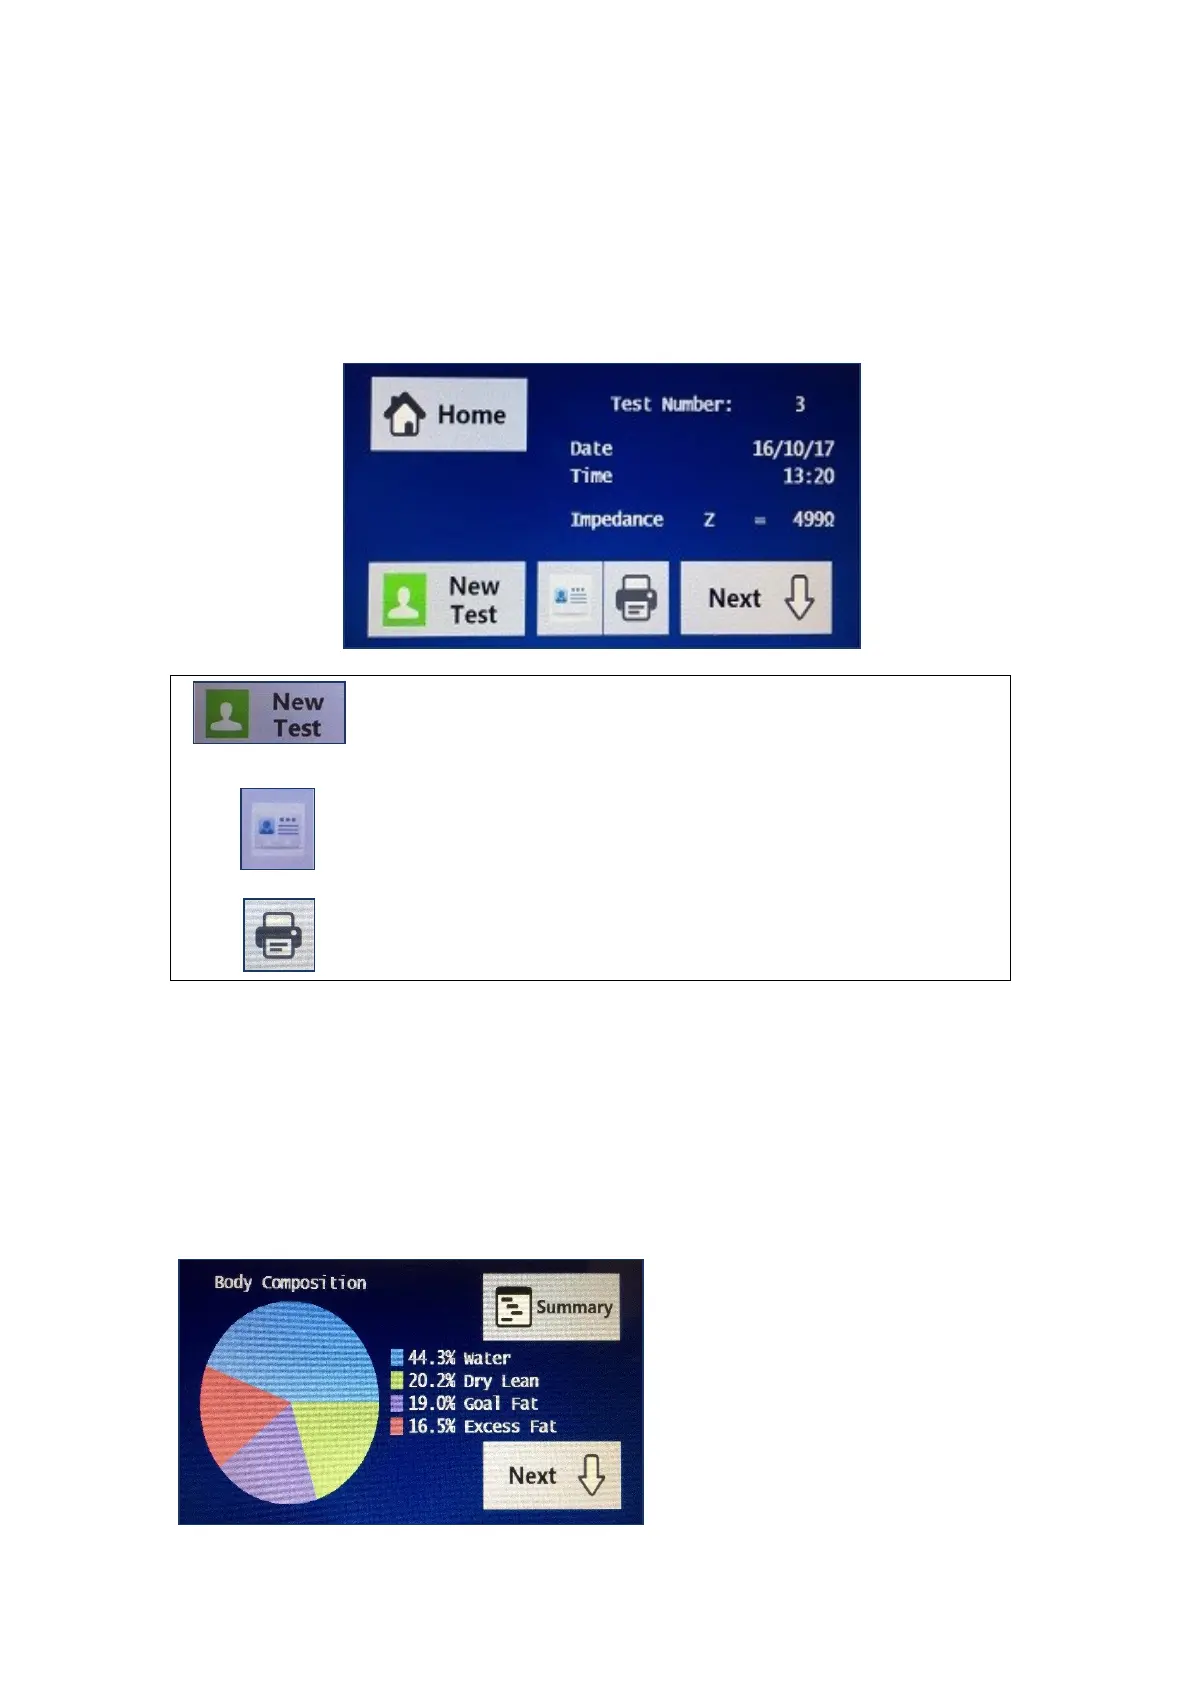
The first screen displayed is the test summary screen which shows the
Impedance at 50 kHz.
Once the summary screen has been displayed, a new
test can now be performed by selecting the new test
button.
Alternatively, the results for that particular test can be
viewed by selecting the results icon.
To print the results to the paired thermal printer, select
the print icon.
RESULTS ICON
If the results icon has been pressed, then the first screen displayed is the input
data that was entered for that particular test. By pressing the next button the
result output data is now displayed. If the next arrow was pressed from the
summary screen, then the first screen displayed is the actual results for that
subject.
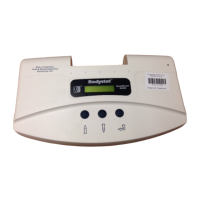
The first result screen
displayed is the body
composition pie chart for that
particular test. Each pie chart
shows the Fat, Water and Dry
Lean.