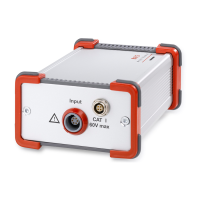
Approximation
The “approximation” button
adds a blue approximation
curve
between the two se-
lectable measurement
points. The two points can
be selected in settings by
clicking on “approximation”
as a frequency index.
The two frequency indices
are pre-set to the first
measurement point (e.g. 1:
1 kHz) and to the last meas-
urement point (e.g. 9: 2.2
Hz), but they can also be
changed. Enter the desired frequency index in the left-hand field and confirm with =>.
The parameters R
s
, R
p
and C
p
of the simplified
Randles equivalent circuit diagram are calculated with
the help of the approximation and the results are
shown to the left of the graphic.
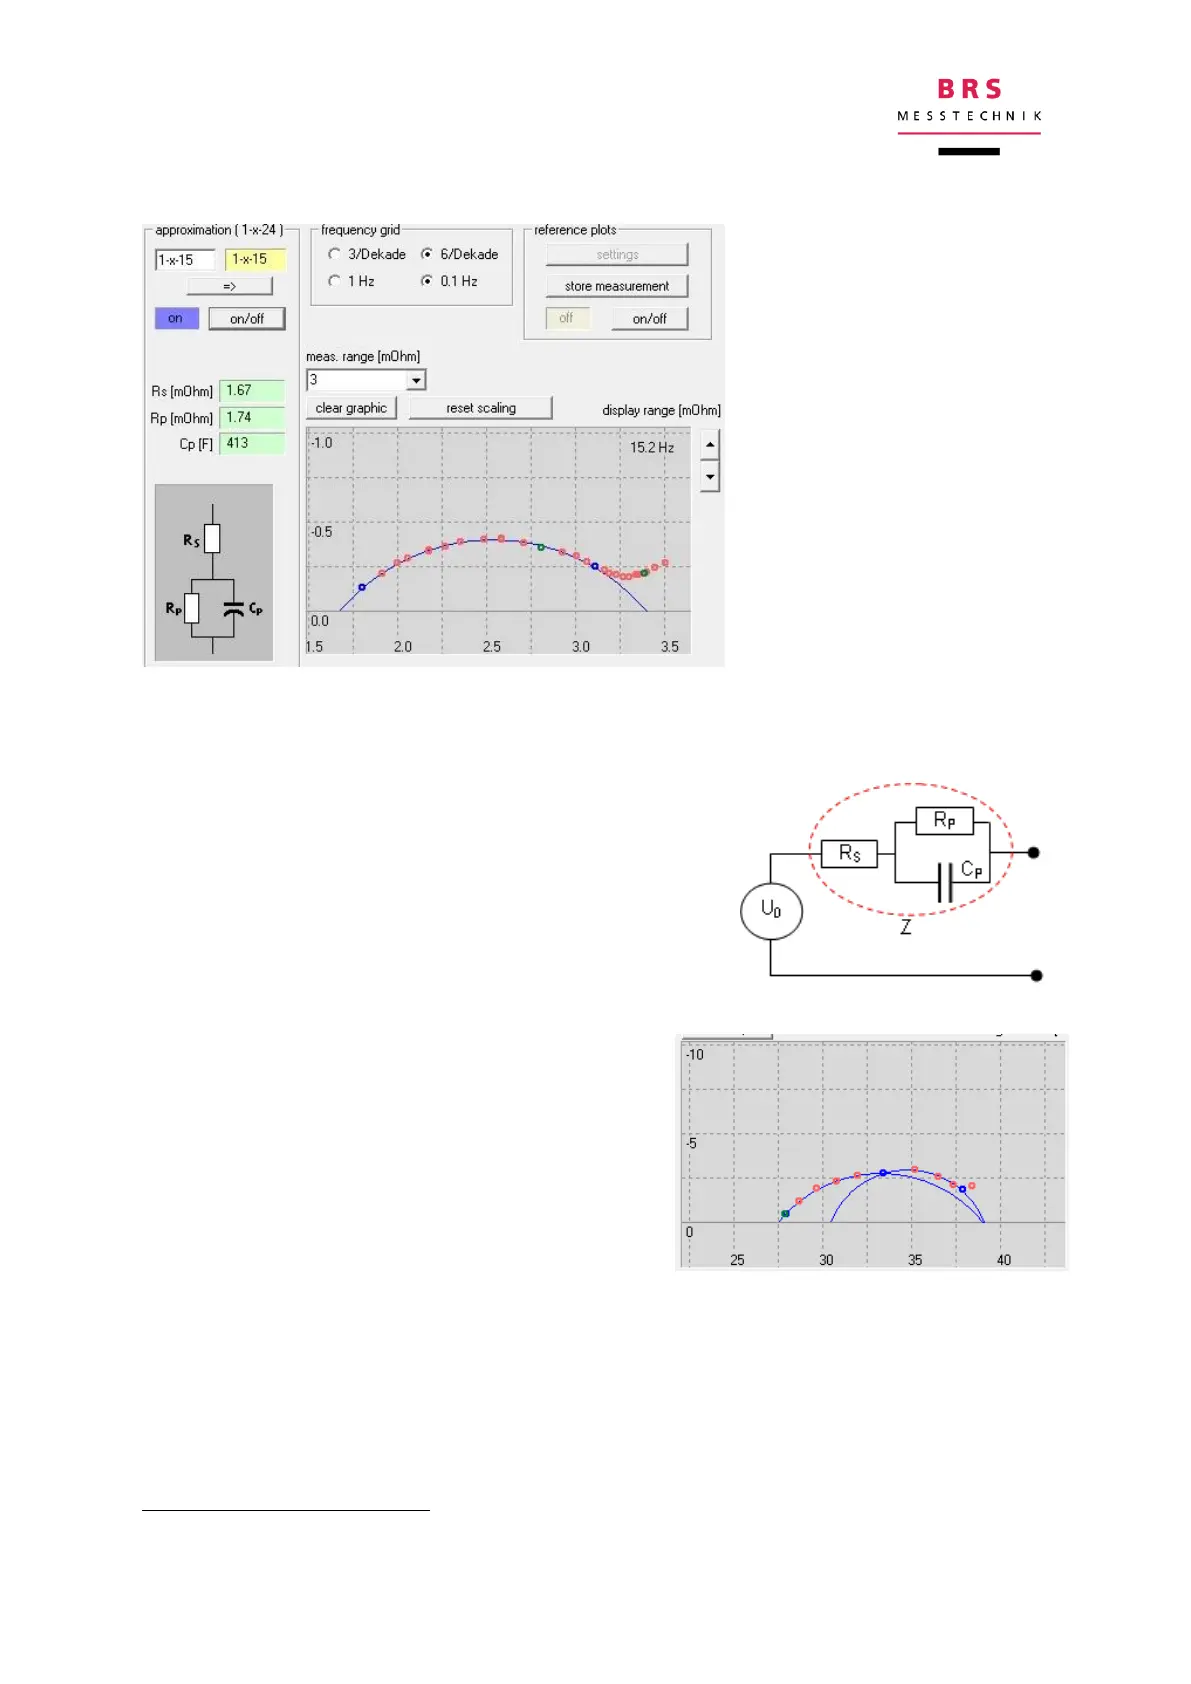
In some cases, two half curves can be identified
(which represent one electrode each). These
two half curves can be separately approximated
in such a way that a third frequency index is de-
termined in the middle, i.e. the x is replaced with
a number. This represents the cross-over be-
tween the two approximation curves.
The approximation is done using the ZARC model (tilted arch impedance)