Reference curves
The measured Nyquist curves can be saved and
displayed for comparison. They also serve as
must curves in the tolerance test.
After completion of a measurement cycle, the re-
sults are saved by clicking “store measurement”
.
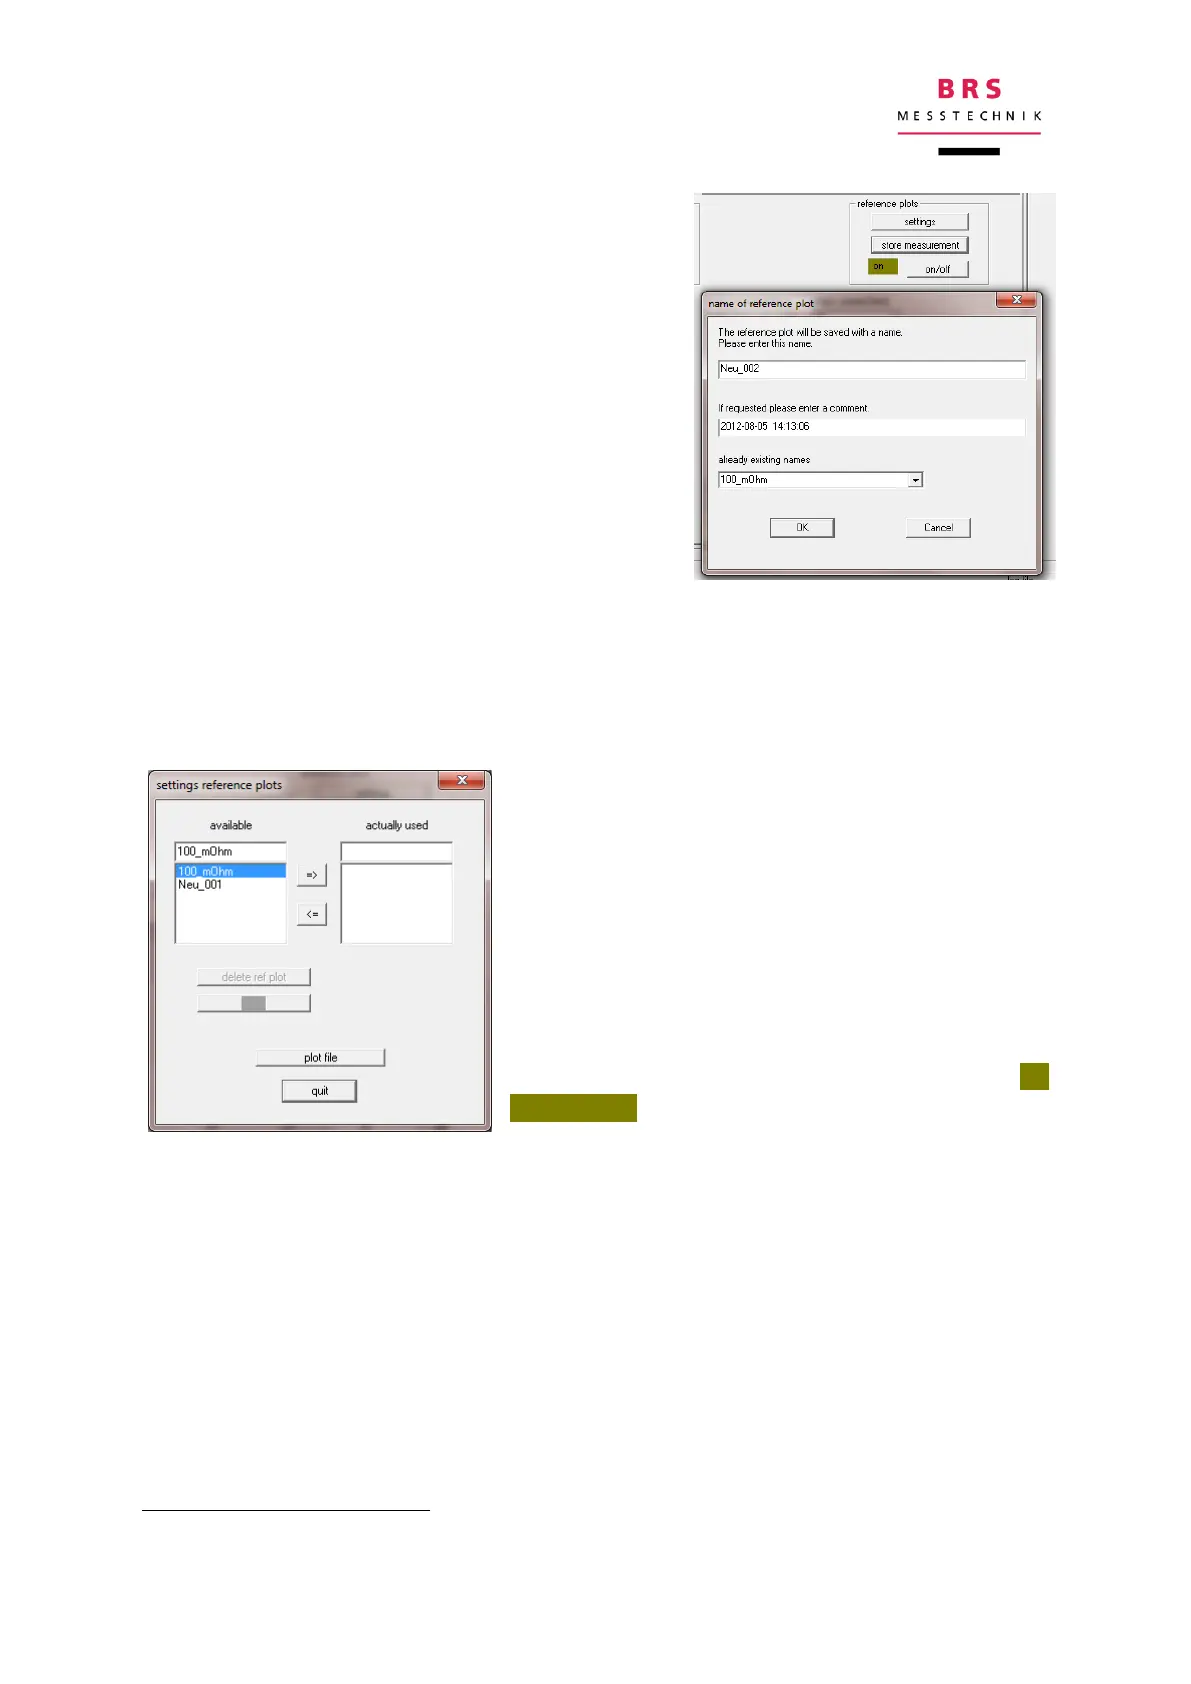
If there are still no complete location curves, a
message will inform you of this. If there is a com-
plete location curve, another window will open
where you can add a name and a note to the lo-
cation curve to be saved. The file is saved when
you click OK, which will save the most recent
complete point sequence.
To show the reference curves:
First click the “on/off” button, and then click the “settings” button.
The available curves are shown in the window
which then opens (see left).
You can see a preview of this by simply marking
the desired curve in this field.
The relevant reference curve (in red) is blended in
with the associated notes (temporarily).
The reference curve can be permanently blended
in by clicking on the “=>” button.
Permanent reference curves are shown in or-
ange/yellow and the notes are not shown.
Permanent reference curves can be selected again later if you mark them as “in use”
in the field.
The values can be shown numerically in a notepad file by clicking on the “plot data”
button.
They are stored in the file „ RefPlot.txt”