CASIO ClassPad 330 and ClassPad Manager Software Version 3.04
Copyright © 2009 CASIO COMPUTER CO., LTD. All Rights Reserved.
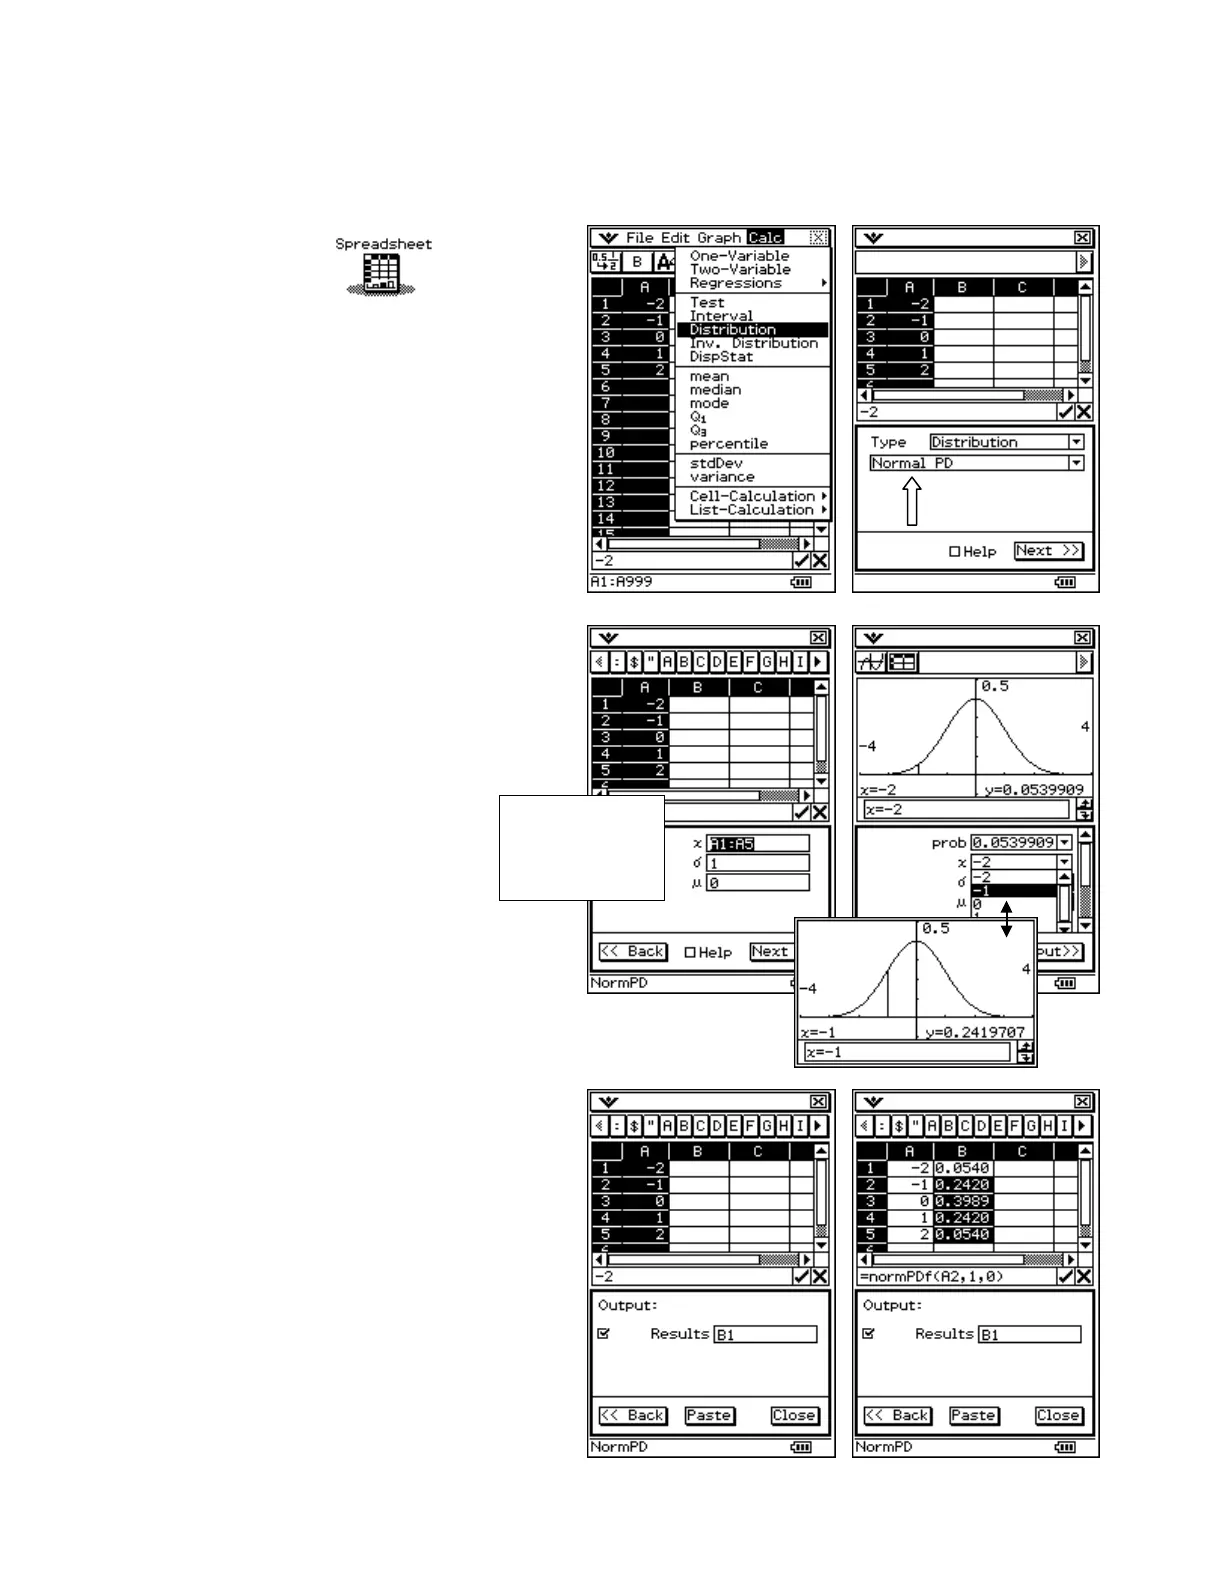
Using the Statistics Wizard in the Spreadsheet Application
Graphing Results
a. With Normal PD selected from
the drop down list, tap Next
b. Input the other data shown
c. Tap Next
d. Tap $
e. Following Prob, tap the n and
select another value
f. Notice the graph updates
automatically!
Finding the Statistics Wizard
a. Tap m and then
b. Select Edit and then Clear All
c. Input the data shown pressing E after
each entry
d. Tap the column heading for column A to
select it
e. Open the Calc menu and select
Distribution
Outputting Results
a. Tap in the graph window to give
it focus
b. Tap the upper S to close the
graph
c. Tap Output >>
d. Tap Paste to place the results
starting at B1
is in the first
field!