CASIO ClassPad 330 and ClassPad Manager Software Version 3.04
Copyright © 2009 CASIO COMPUTER CO., LTD. All Rights Reserved.
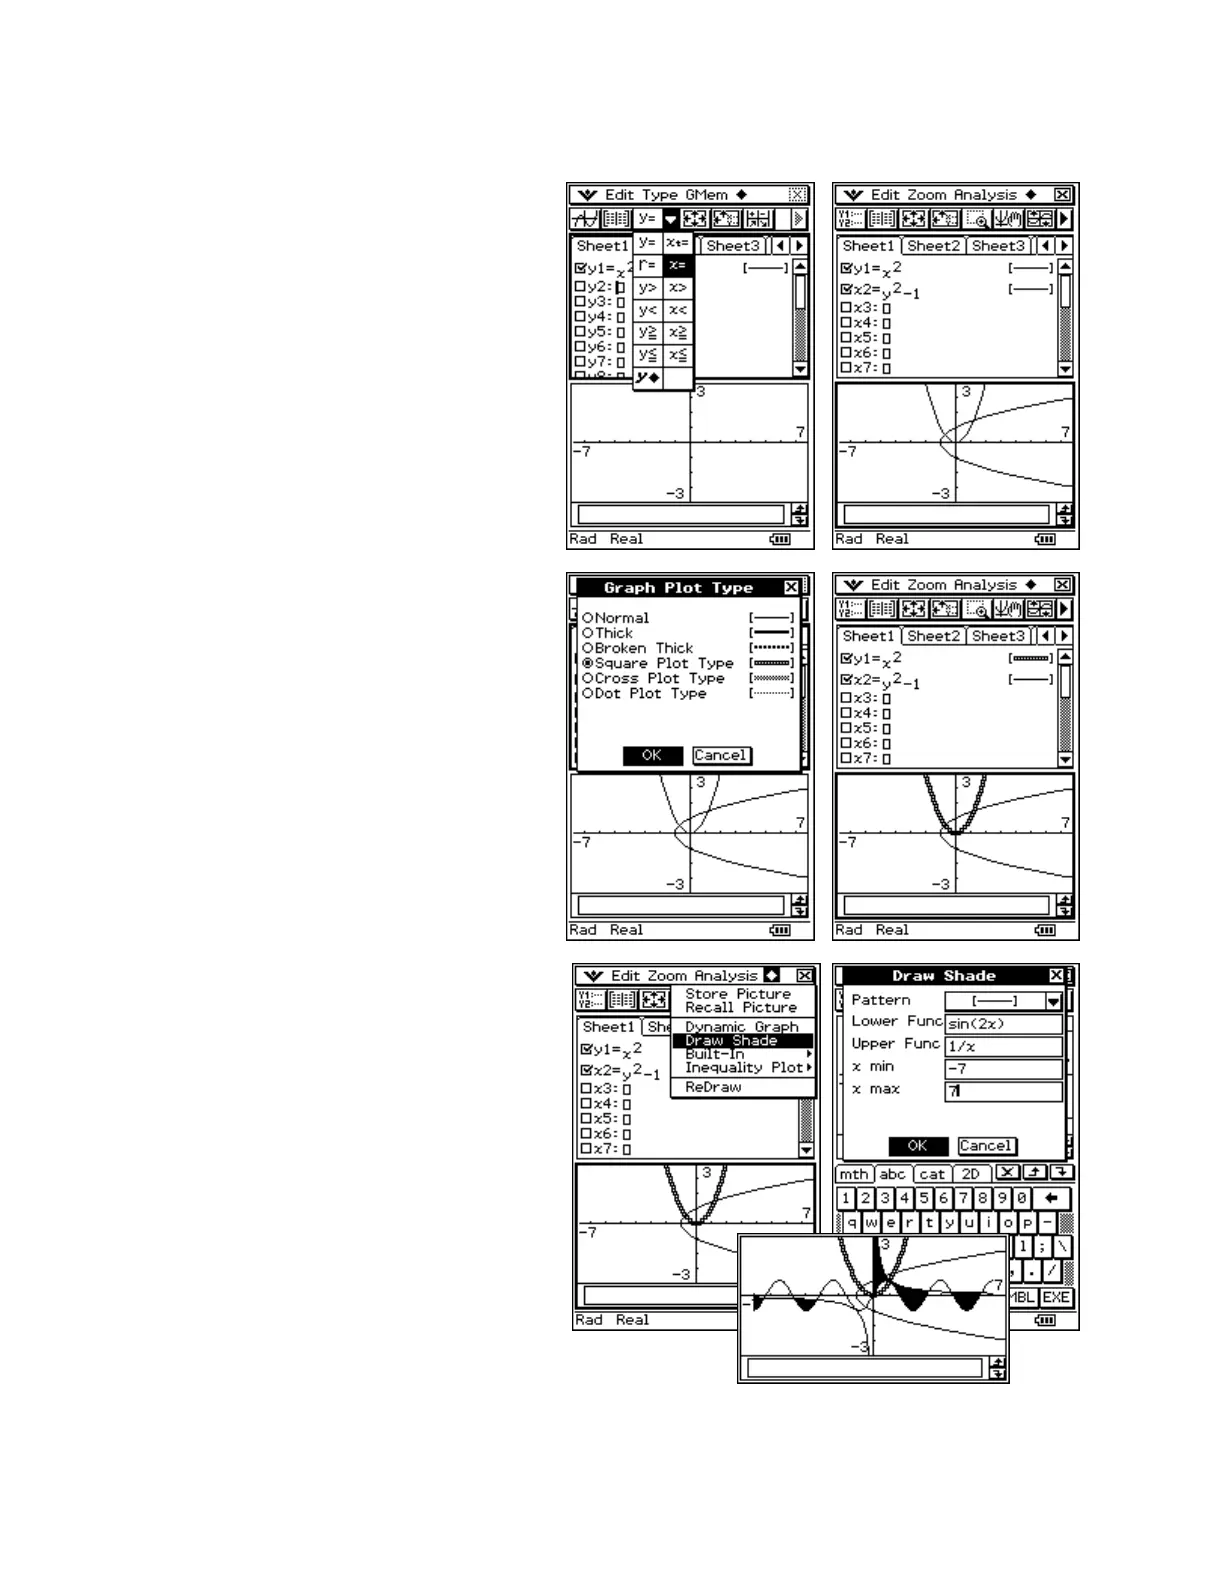
Using the Graph & Table Application
Graphing
a. Tap m and then g
b. Tap in the box following y1
c. Input x{2 and press E
d. Tap # on the toolbar and select h
e. Input y{2-1and press E
f. Tap $ to view your graphs (first icon
on toolbar)
a. Tap [-----] to the right of y1=x
b. Tap a different line style and then OK
c. Tap $ to view your graphs
Using the Shade Type
a. Tap in the Graph window to give it
focus
b. Open the a menu and select Draw
Shade
c. Open the keyboard and input the data
shown
d. When finished, tap OK
e. For fun, tap the r button twice