100
Chapter 7 Statistical Graphs and Calculations
1234
1234[
uu
uu
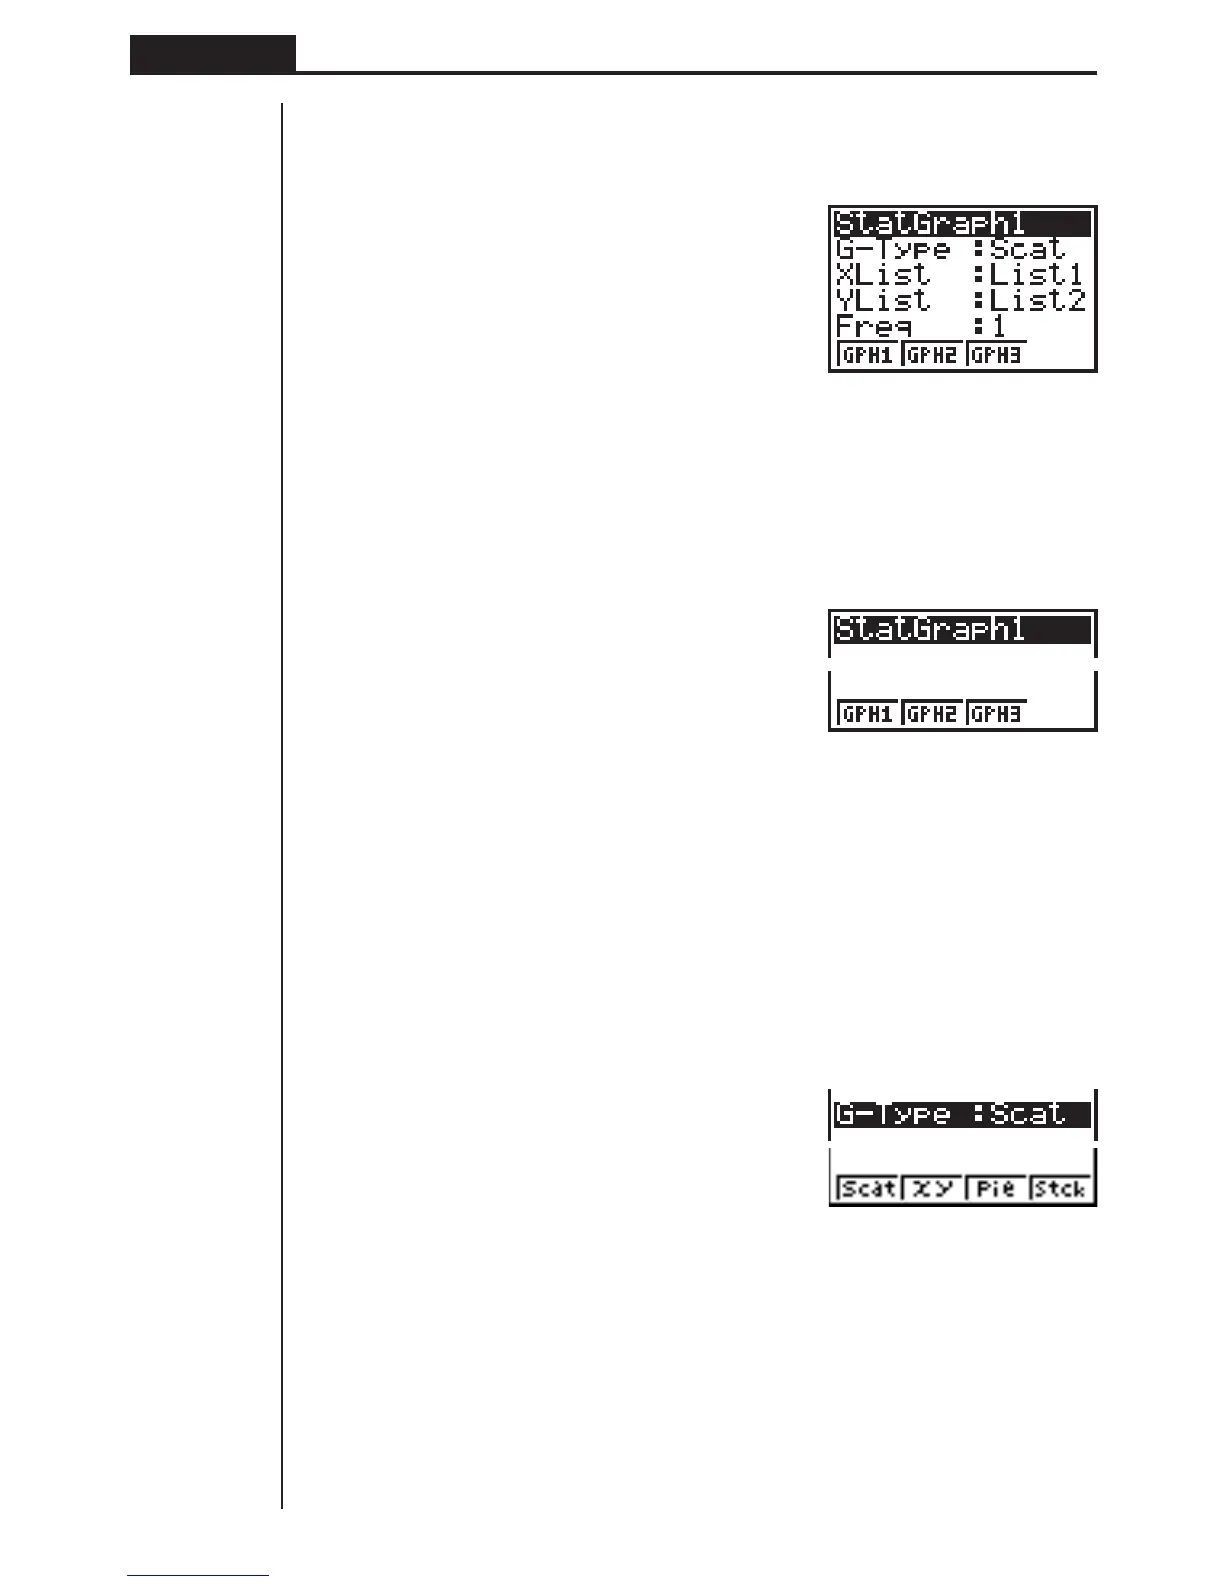
uTo display the general graph settings (SET) screen
While the graph menu is on the display, press [4 (SET) to display the general
graph settings screen.
1(GRPH)
[4(SET)
• The settings shown here are examples only. The settings on your general graph
settings screen may differ.
uu
uu
uTo select the StatGraph area
1. While the general graph settings screen is on the display, use f and c to
move the highlighting to the StatGraph item.
2. Use the function key menu to select the StatGraph area you want to select.
1 (GPH1) ..... Graph 1
2 (GPH2) ..... Graph 2
3 (GPH3) ..... Graph 3
uu
uu
uTo select the graph type (G-Type)
1. While the general graph settings screen is on the display, use f and c to
move the highlighting to the G-Type item.
2. Use the function key menu to select the graph type you want to select.
1 (Scat) ........ Scatter diagram
2 (
xy) ........... xy line graph
3 (Pie) .......... Pie chart
4 (Stck) ........ Stacked bar chart