58
Chapter 4 Graphing
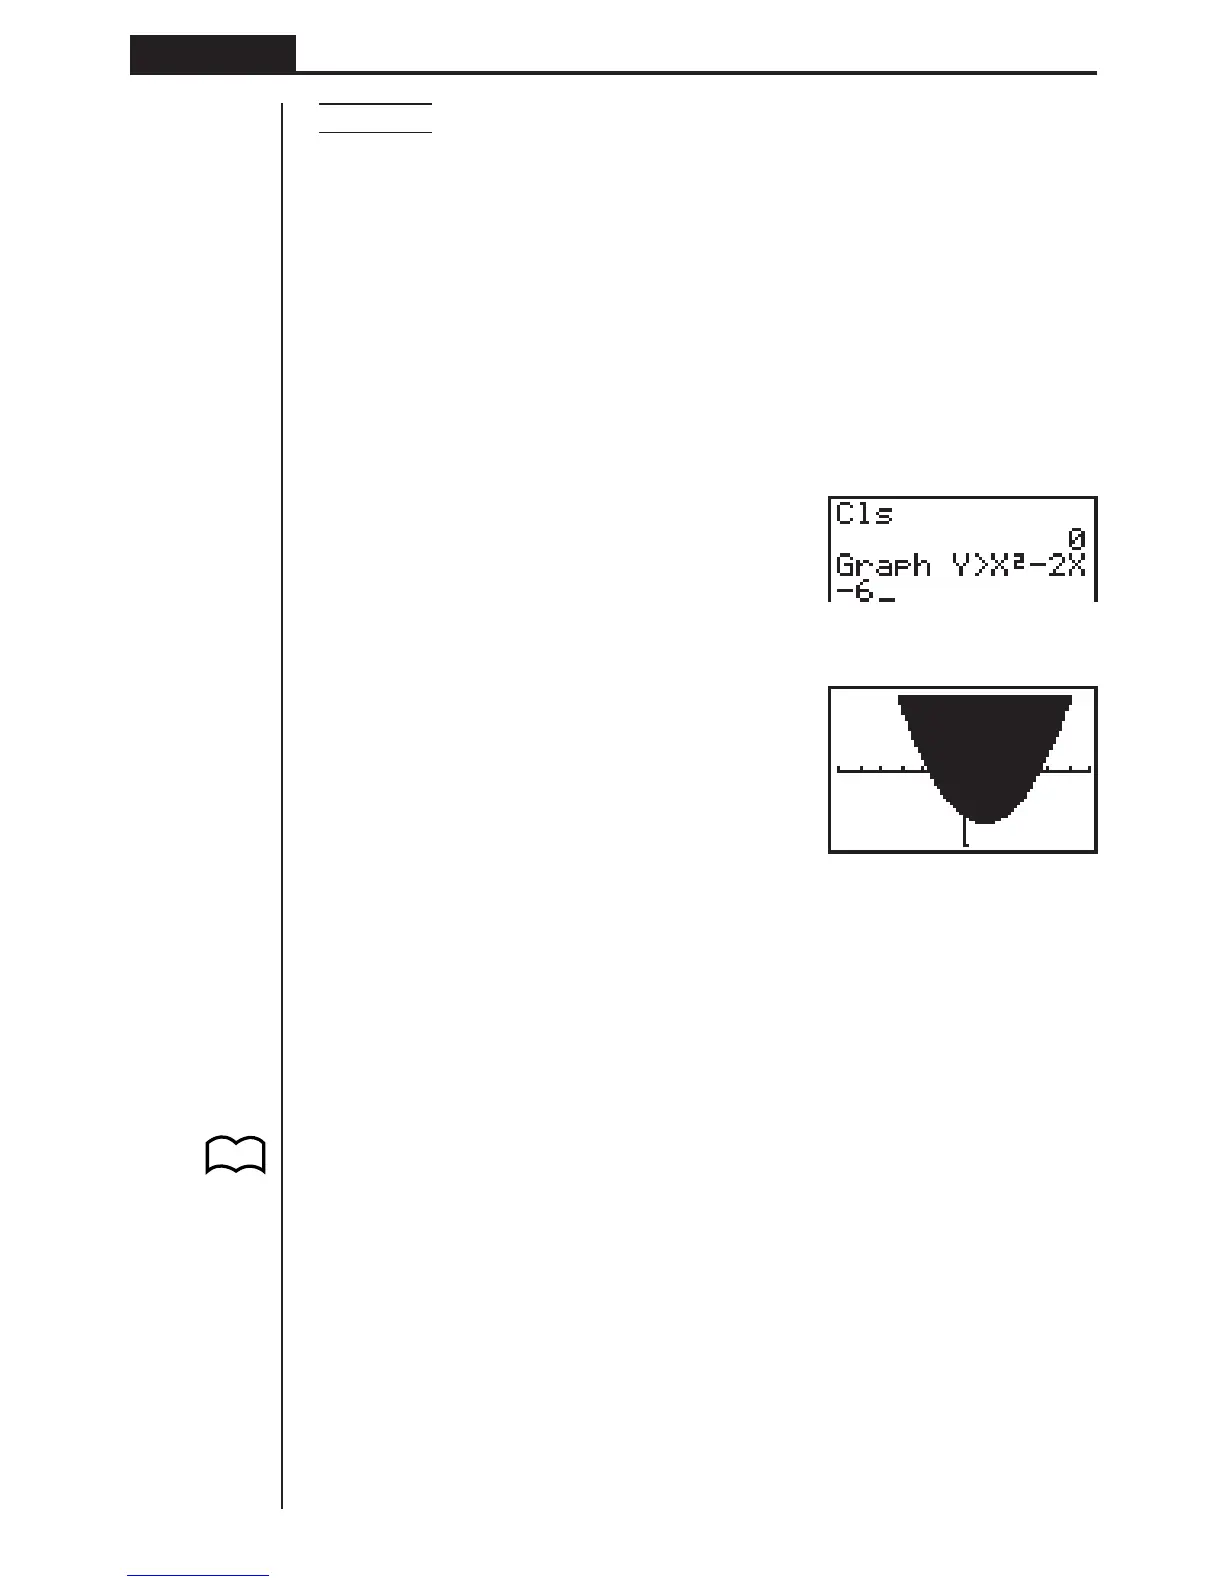
Example To graph the inequality y > x
2
– 2x – 6
Use the following View Window parameters.
Xmin = –6 Ymin = –10
Xmax = 6 Ymax = 10
Xscl = 1 Yscl = 5
1. In the set-up screen, specify the appropriate graph type for F-Type.
!Z[1(Y>)Q
2. Input the inequality.
A!4(SKTCH)1(Cls)w
2(GRPH)[1(Y>)
Tx-cT-g
3. Press w to draw the graph.
w
5. Other Graphing Functions
The functions described in this section tell you how to read the x- and y-coordinates
at a given point, and how to zoom in and zoom out on a graph.
• These functions can be used with rectangular coordinate, parametric, and in-
equality graphs only.
kk
kk
k Connect Type and Plot Type Graphs (D-Type)
You can use the D-Type setting of the set-up screen to specify one of two graph
types.
•Connect type (Conct)
Points are plotted and connected by lines to create a curve.
• Plot
Points are plotted without being connected.
P.7